Fig. 5
Download original image
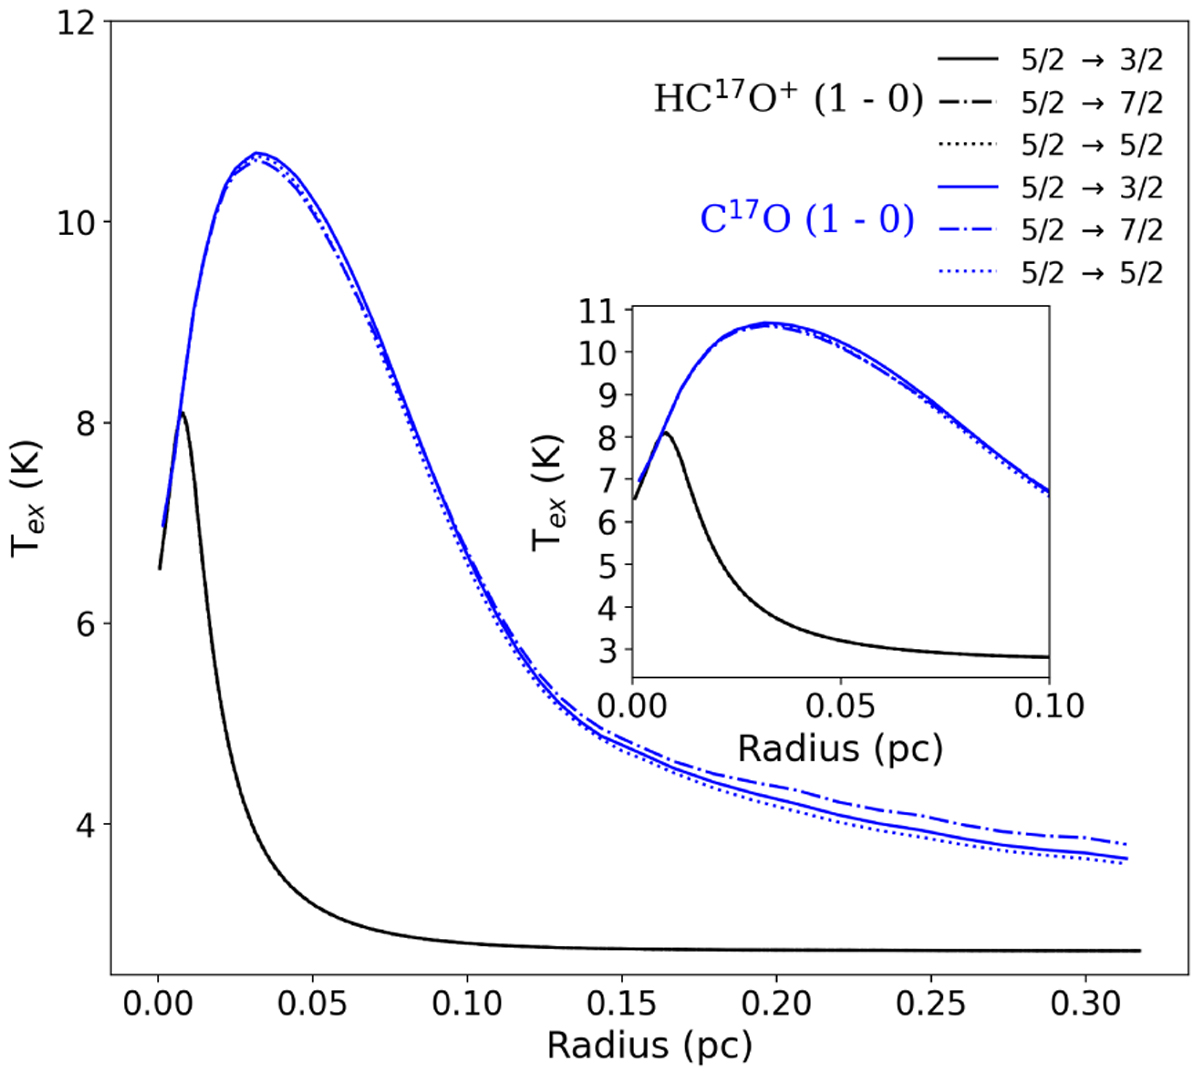
Excitation temperature profile of the three HC17O+(1−0) and C17O(1−0) hyperfine transitions across the core. The HC17O+(1−0) 5/2 → 3/2, 5/2 → 7/2, and 5/2 → 5/2 transitions are plotted as a black solid line, a black dash-dotted line, and a black dotted line, respectively. The profiles for HC17O+ are superimposed. The C17O(1−0) 5/2 → 3/2, 5/2 → 7/2, and 5/2 → 5/2 transitions are plotted as a blue solid line, a blue dash-dotted line, and a blue dotted line, respectively. The inset presents a zoom-in of the radial Tex profile from 0 to 0.1 pc.
Current usage metrics show cumulative count of Article Views (full-text article views including HTML views, PDF and ePub downloads, according to the available data) and Abstracts Views on Vision4Press platform.
Data correspond to usage on the plateform after 2015. The current usage metrics is available 48-96 hours after online publication and is updated daily on week days.
Initial download of the metrics may take a while.