Fig. 4
Download original image
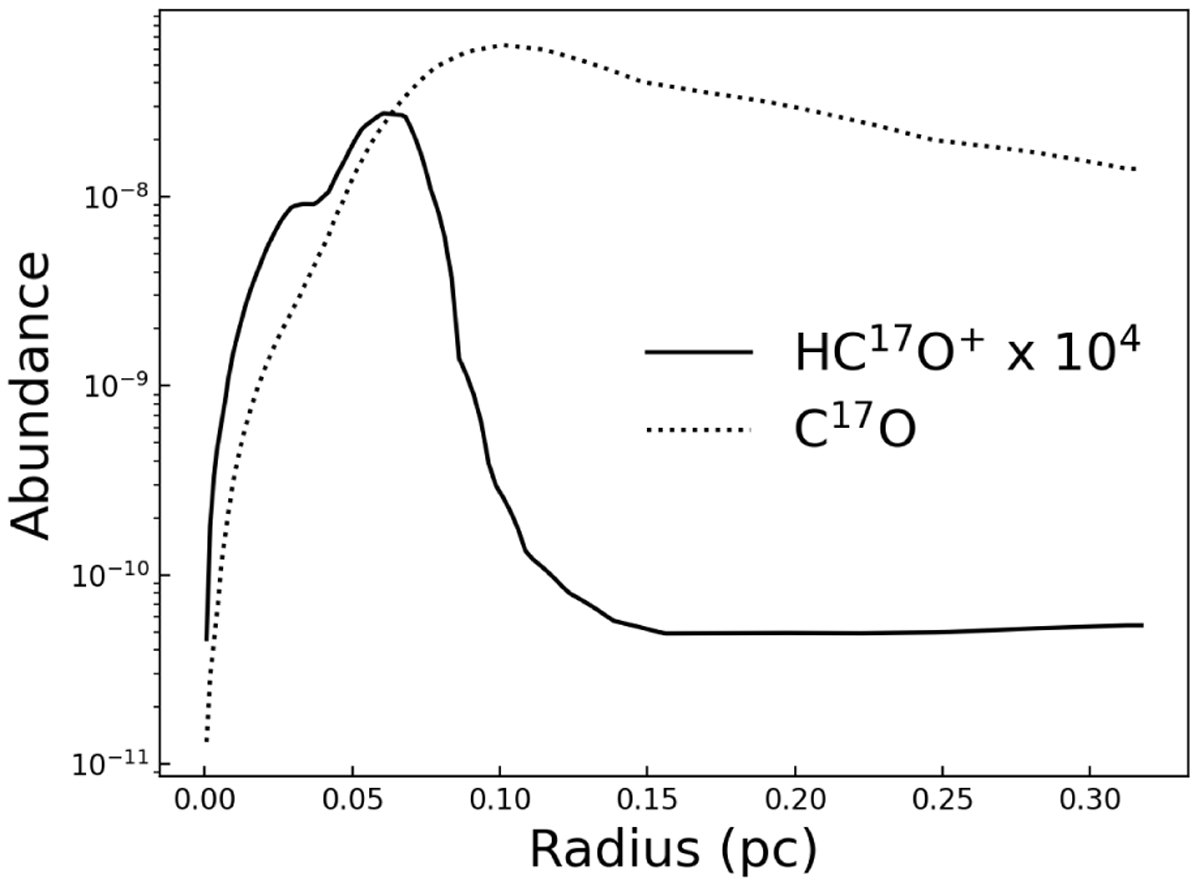
Comparison between the HC17O+ and C17O radial abundance profiles. The dotted curve shows the C17O fractional abundance (abundance with respect to H2) as a function of radius. The solid curve shows the fractional abundance of HC17O+, scaled by 104 computed with the chemical code from Sipilä et al. (2015, 2019) by scaling the CO and HCO+ fractional abundance profiles by the isotope ratio [16O/17O] = 2044 (Penzias 1981; Wilson & Rood 1994).
Current usage metrics show cumulative count of Article Views (full-text article views including HTML views, PDF and ePub downloads, according to the available data) and Abstracts Views on Vision4Press platform.
Data correspond to usage on the plateform after 2015. The current usage metrics is available 48-96 hours after online publication and is updated daily on week days.
Initial download of the metrics may take a while.