Fig. 3
Download original image
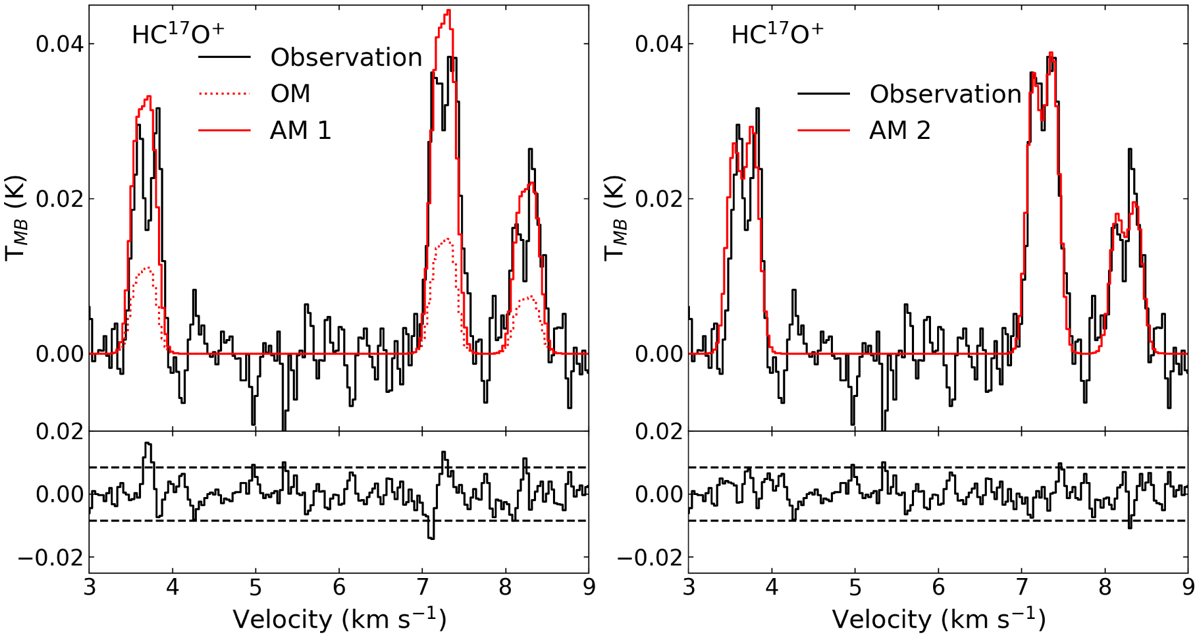
The results of the HC17O+ observed spectrum modelling with LOC are displayed. Left: observed spectrum of the HC17O+ (1−0) (black), the result of a simulation using the original HC17O+ fractional abundance profile at 5 × 10⁵ yr and the original pre-stellar core model (OM; dotted red) and the result of a simulation using the HC17O+ fractional abundance profile at 5 × 10⁵ yr upscaled by a factor of 4 times that of the original pre-stellar core model (AM 1; solid red). Residuals are computed with the adopted model and are shown in the lower panel. The dashed lines represent the 3σ levels. Right: observed spectrum of the HC17O+ (1−0) (black) and the result of a simulation using the HC17O+ fractional abundance profile at 5 × 10⁵ yr upscaled by a factor of 4 and an upscaled velocity profile by 30% (AM 2; solid red). Residuals are computed with the adopted model and are shown in the lower panel. The dashed lines represent the 3σ levels.
Current usage metrics show cumulative count of Article Views (full-text article views including HTML views, PDF and ePub downloads, according to the available data) and Abstracts Views on Vision4Press platform.
Data correspond to usage on the plateform after 2015. The current usage metrics is available 48-96 hours after online publication and is updated daily on week days.
Initial download of the metrics may take a while.