Open Access
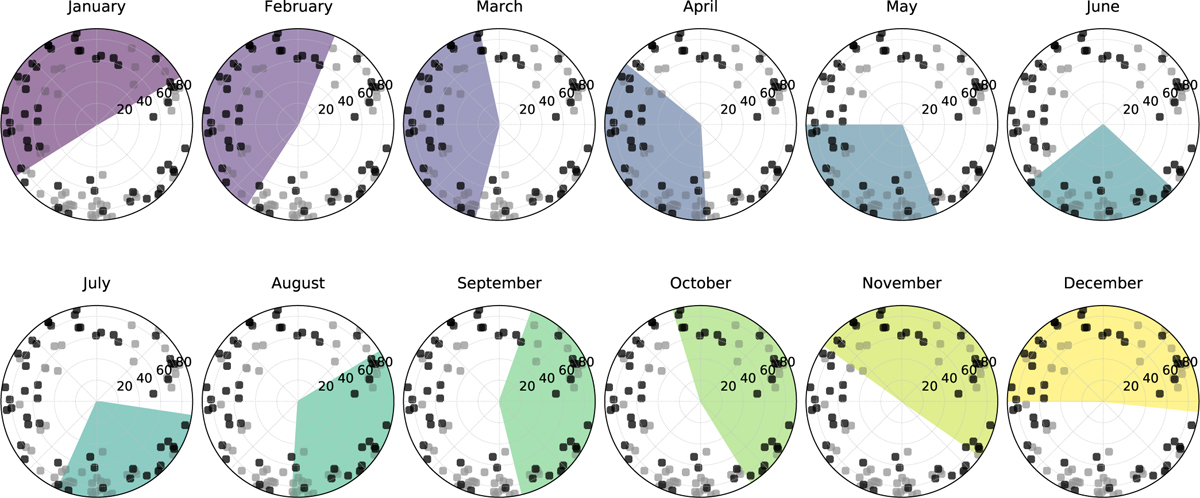
Fig. 6
Download original image
Location and visibility of the KOBE sample including the BLT (black symbols) and bBTL (gray symbols). For each month, the shaded colored region represents the region of the sky observable from САНА.
Current usage metrics show cumulative count of Article Views (full-text article views including HTML views, PDF and ePub downloads, according to the available data) and Abstracts Views on Vision4Press platform.
Data correspond to usage on the plateform after 2015. The current usage metrics is available 48-96 hours after online publication and is updated daily on week days.
Initial download of the metrics may take a while.