Fig. 4
Download original image
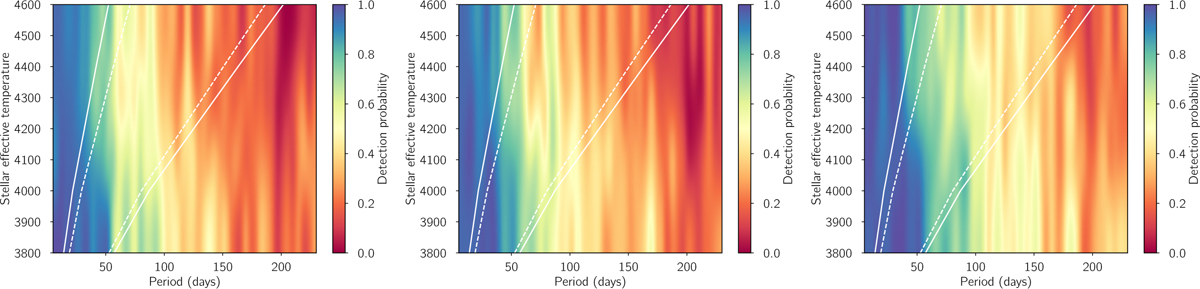
Detectability maps of the KOBE experiment in the habitable zone (white solid lines for the optimistic HZ and dashed for the conservative HZ) of K4-M0 stars based on three observing strategies, from left to right: four semesters × 18 datapoints (left), 4 × 23 (middle), and 5 × 23 (right). Color-code shows the detection probability for a 5 M⊕ planet at each location of the parameter space.
Current usage metrics show cumulative count of Article Views (full-text article views including HTML views, PDF and ePub downloads, according to the available data) and Abstracts Views on Vision4Press platform.
Data correspond to usage on the plateform after 2015. The current usage metrics is available 48-96 hours after online publication and is updated daily on week days.
Initial download of the metrics may take a while.