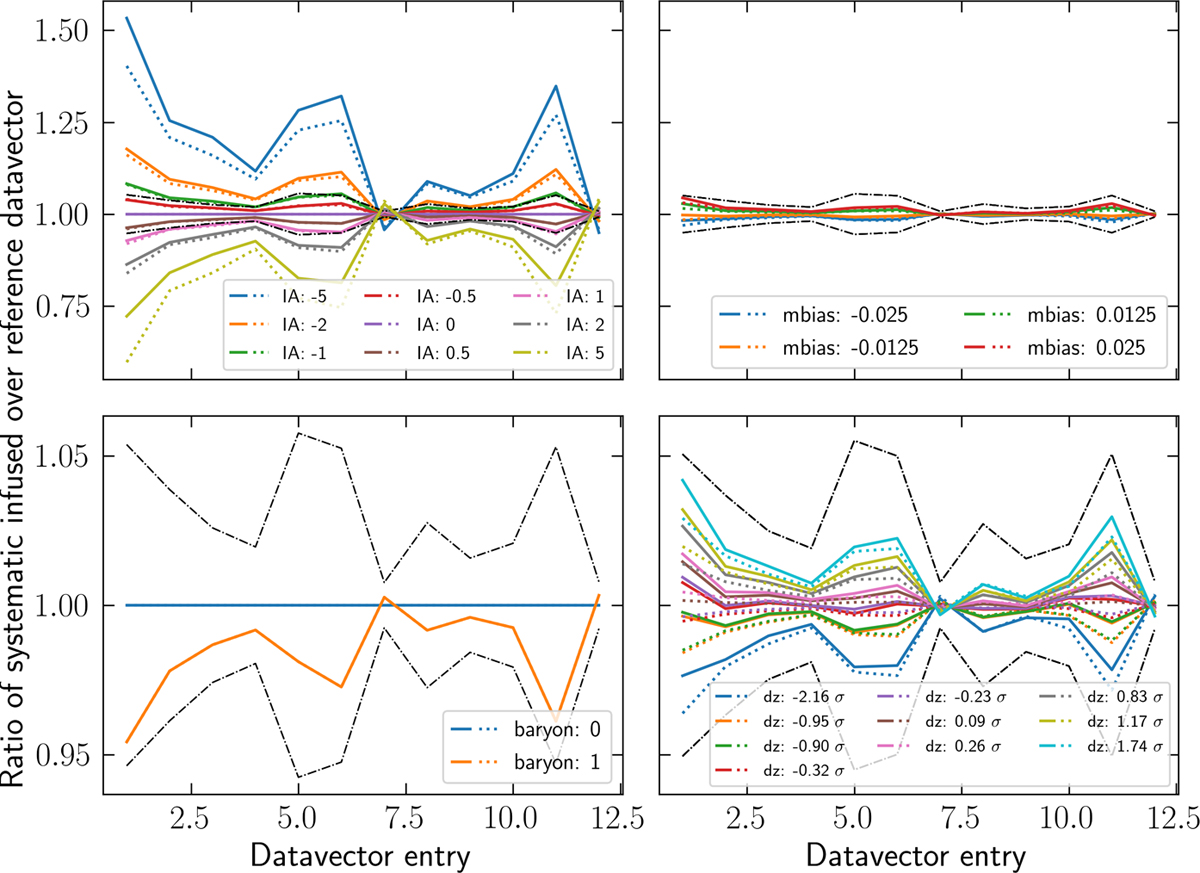
Fig. 7.
Download original image
Impact of the main systematic effects on the data vector. For each systematic, we show the measured (solid line) and interpolated (dotted line) ratio of the systematic-infused data vector over a reference data vector. For simplicity, we only show the results for the combination of all four tomographic redshift bins. The black dashed lines correspond to the 1σ standard deviation estimated from the Covariance Training Set.
Current usage metrics show cumulative count of Article Views (full-text article views including HTML views, PDF and ePub downloads, according to the available data) and Abstracts Views on Vision4Press platform.
Data correspond to usage on the plateform after 2015. The current usage metrics is available 48-96 hours after online publication and is updated daily on week days.
Initial download of the metrics may take a while.