Fig. 5.

Download original image
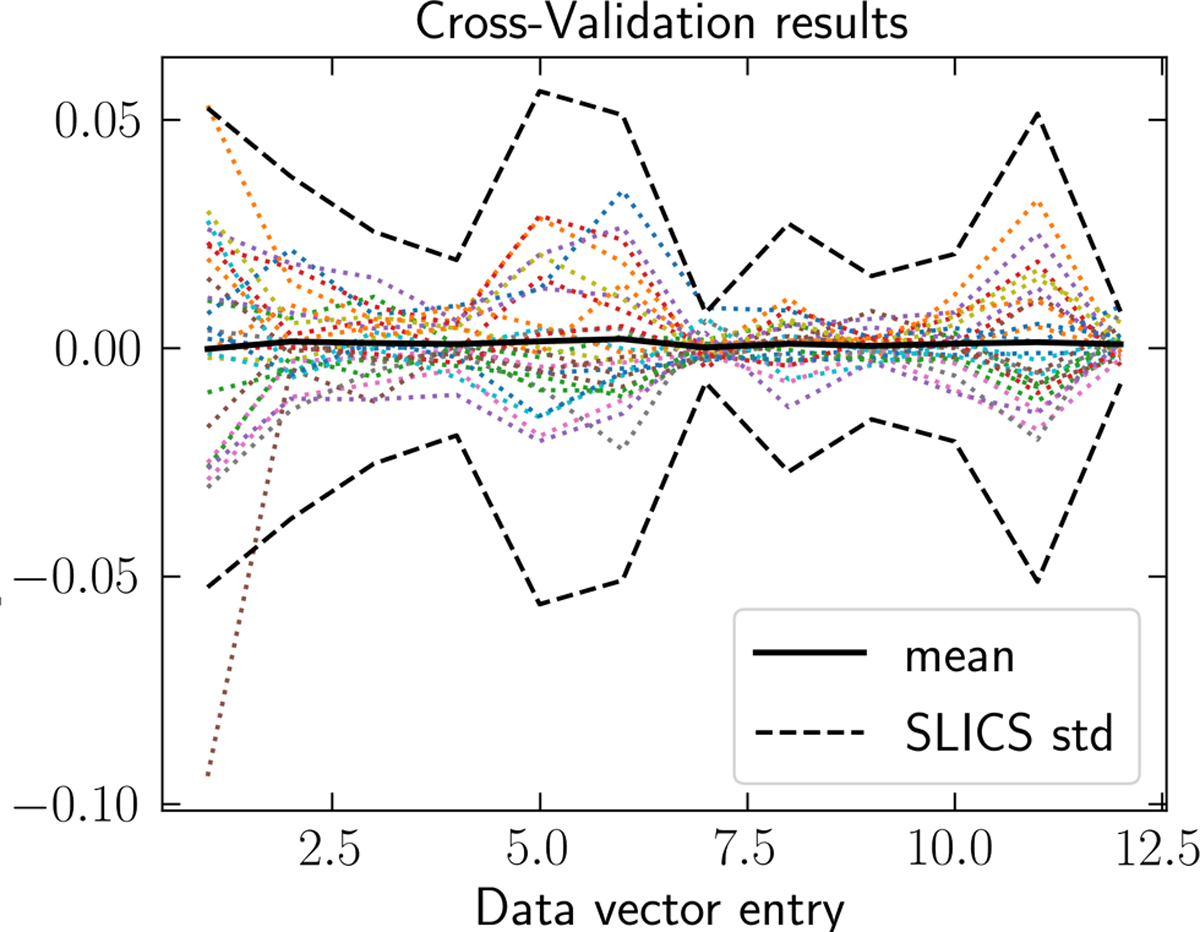
Accuracy of the GPR emulator evaluated by a leave-one-out cross-validation, shown here for the case where the aperture mass maps are constructed from the concatenation of all four tomographic redshift bins (i.e. no tomography). The x axis depicts the data vector entry, and the y axis the relative difference between predicted and measured value. The 26 individual dotted lines correspond to one cosmology that is left out of the training set and then predicted, the solid black line is the mean of all dotted lines. The black dashed lines depict the standard deviation from the Covariance Training Set.
Current usage metrics show cumulative count of Article Views (full-text article views including HTML views, PDF and ePub downloads, according to the available data) and Abstracts Views on Vision4Press platform.
Data correspond to usage on the plateform after 2015. The current usage metrics is available 48-96 hours after online publication and is updated daily on week days.
Initial download of the metrics may take a while.


