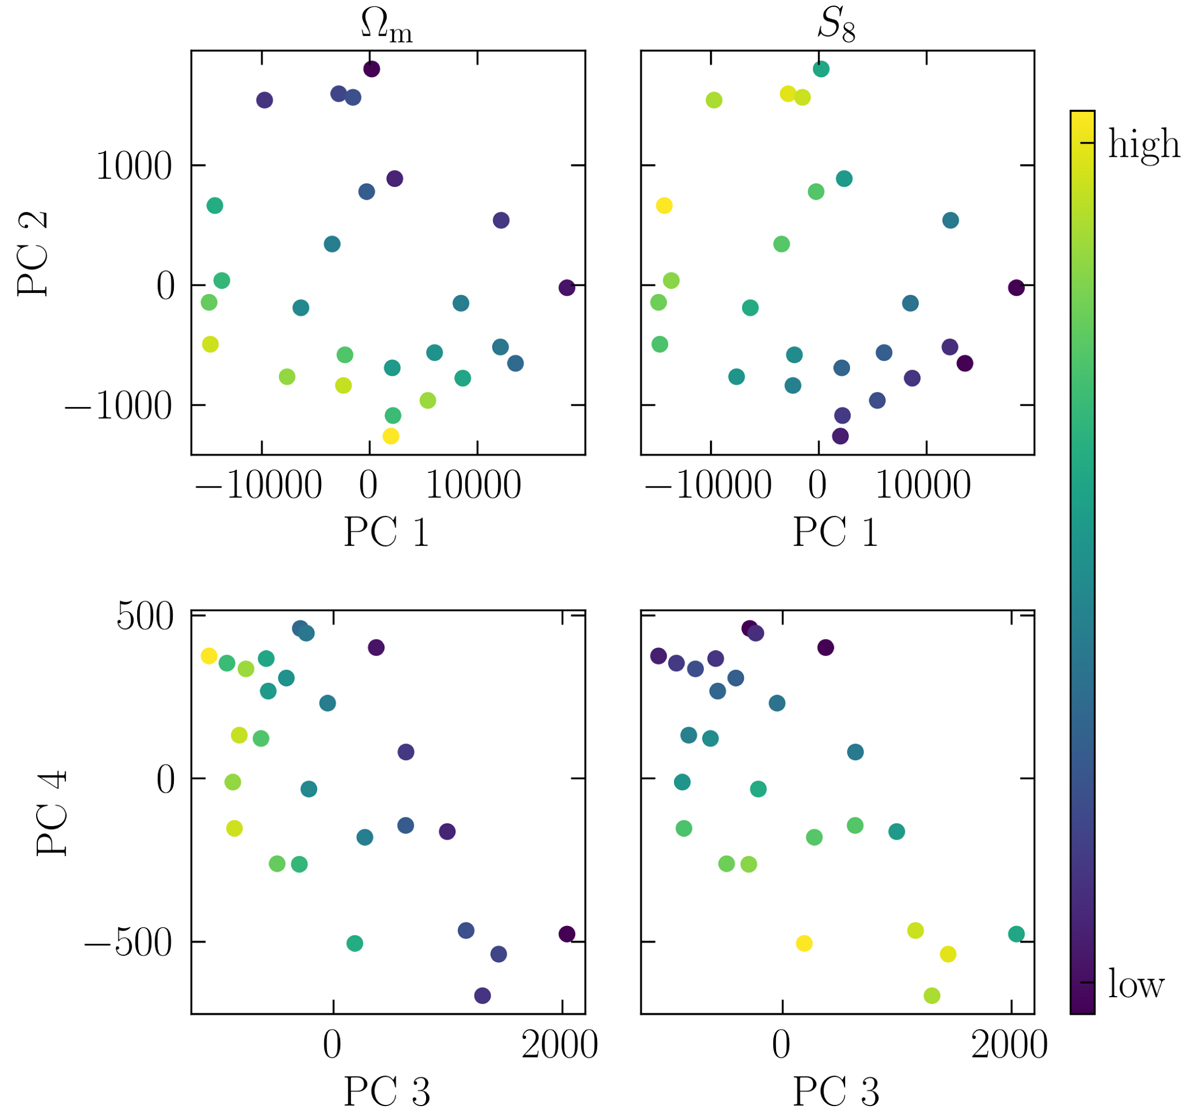
Fig. A.1.
Download original image
Cosmology dependence of the first four principal components. Each point in the scatter plot represents one of the 26 cosmologies of the cosmo-SLICS. In the top row, the x and y coordinates correspond to the value of the first two principal components; in the bottom row, they correspond to the values of the third and fourth principal components. In the left column, the colours represent the value of Ωm of the respective cosmo-SLICS simulation; in the right column, they denote the value of S8.
Current usage metrics show cumulative count of Article Views (full-text article views including HTML views, PDF and ePub downloads, according to the available data) and Abstracts Views on Vision4Press platform.
Data correspond to usage on the plateform after 2015. The current usage metrics is available 48-96 hours after online publication and is updated daily on week days.
Initial download of the metrics may take a while.