Fig. 10.
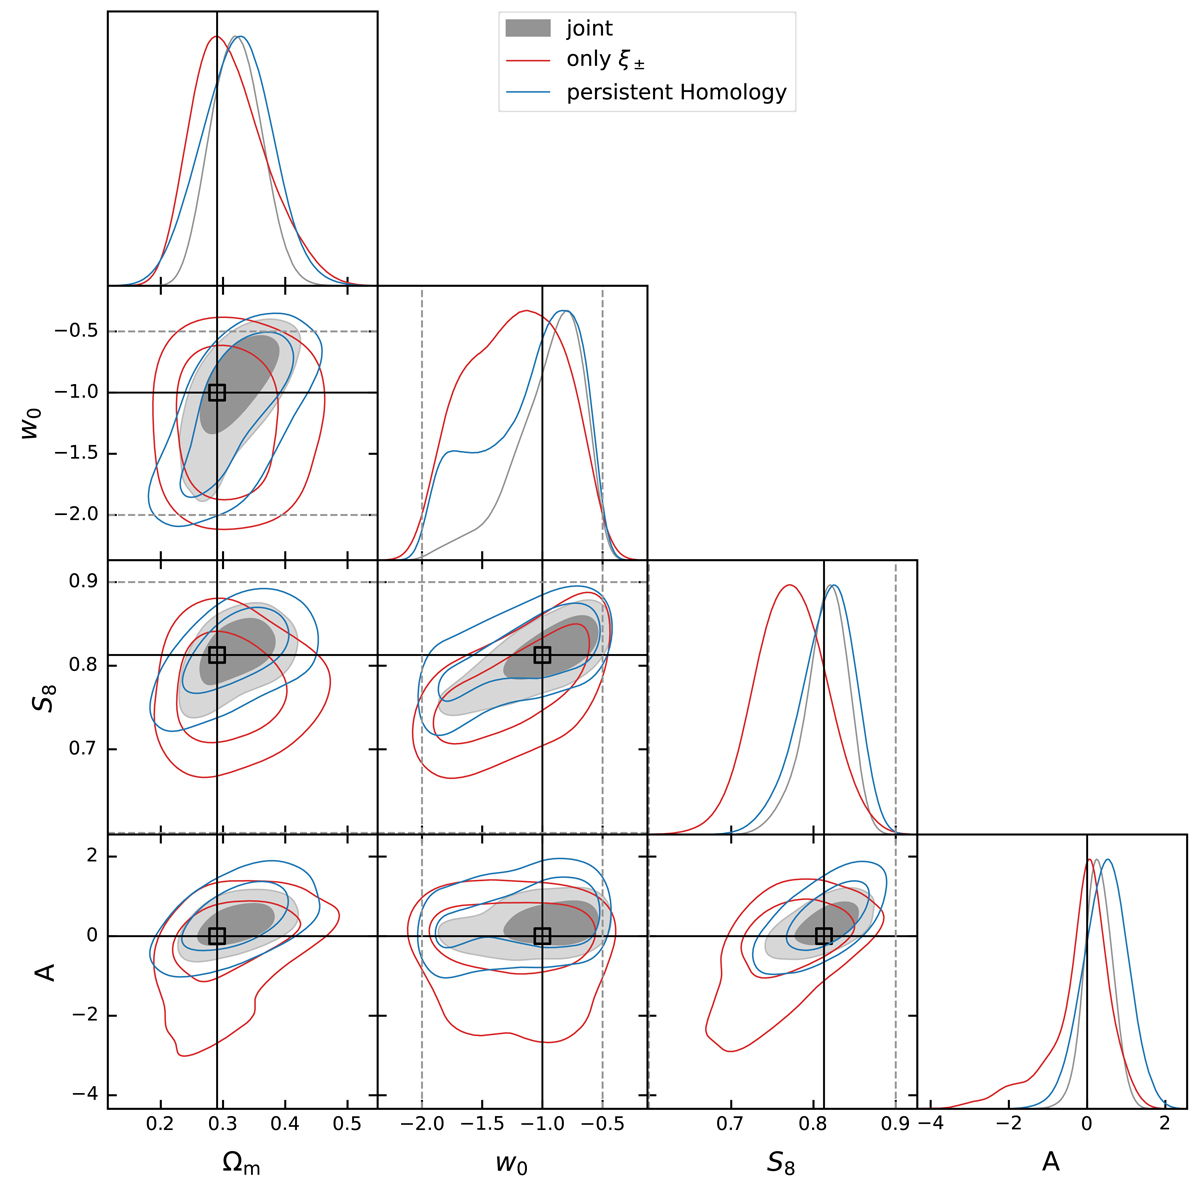
Download original image
Results of likelihood analyses for DES-Y1 mock data. We show the results for two-point statistics (red), persistent homology (blue), and for the joint analysis (grey, filled). The dotted lines show the prior ranges, the solid black lines visualise the true value of each parameter, and the black crosses denote the nodes of our Cosmology Training Set. The complete results can be seen in Fig. C.2, the marginalised posterior constraints can be seen in Table 2.
Current usage metrics show cumulative count of Article Views (full-text article views including HTML views, PDF and ePub downloads, according to the available data) and Abstracts Views on Vision4Press platform.
Data correspond to usage on the plateform after 2015. The current usage metrics is available 48-96 hours after online publication and is updated daily on week days.
Initial download of the metrics may take a while.