Fig. 1.
Download original image
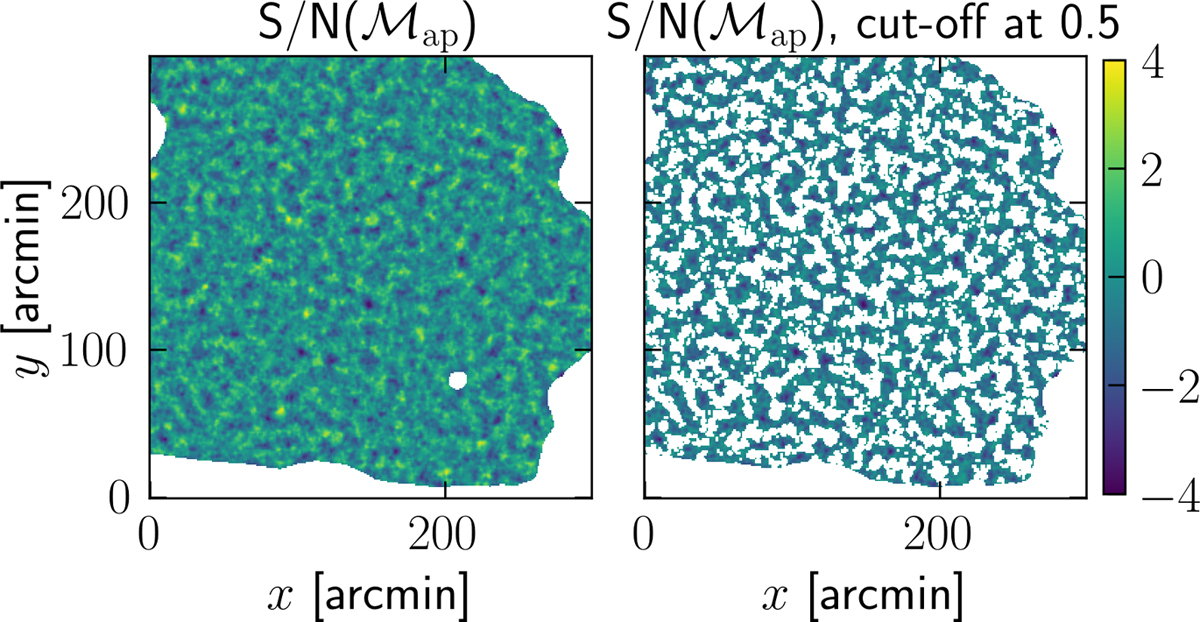
Example signal-to-noise map of aperture masses for a 5 × 5 deg2 sub-patch of one of the Covariance Training Set catalogue (left), and the same map when a threshold of 0.5 is applied (right). The white ‘holes’ in the right map correspond to local maxima of the map and give rise to the topological ‘features’ that are summarised in Dgm1.
Current usage metrics show cumulative count of Article Views (full-text article views including HTML views, PDF and ePub downloads, according to the available data) and Abstracts Views on Vision4Press platform.
Data correspond to usage on the plateform after 2015. The current usage metrics is available 48-96 hours after online publication and is updated daily on week days.
Initial download of the metrics may take a while.