Fig. 9
Download original image
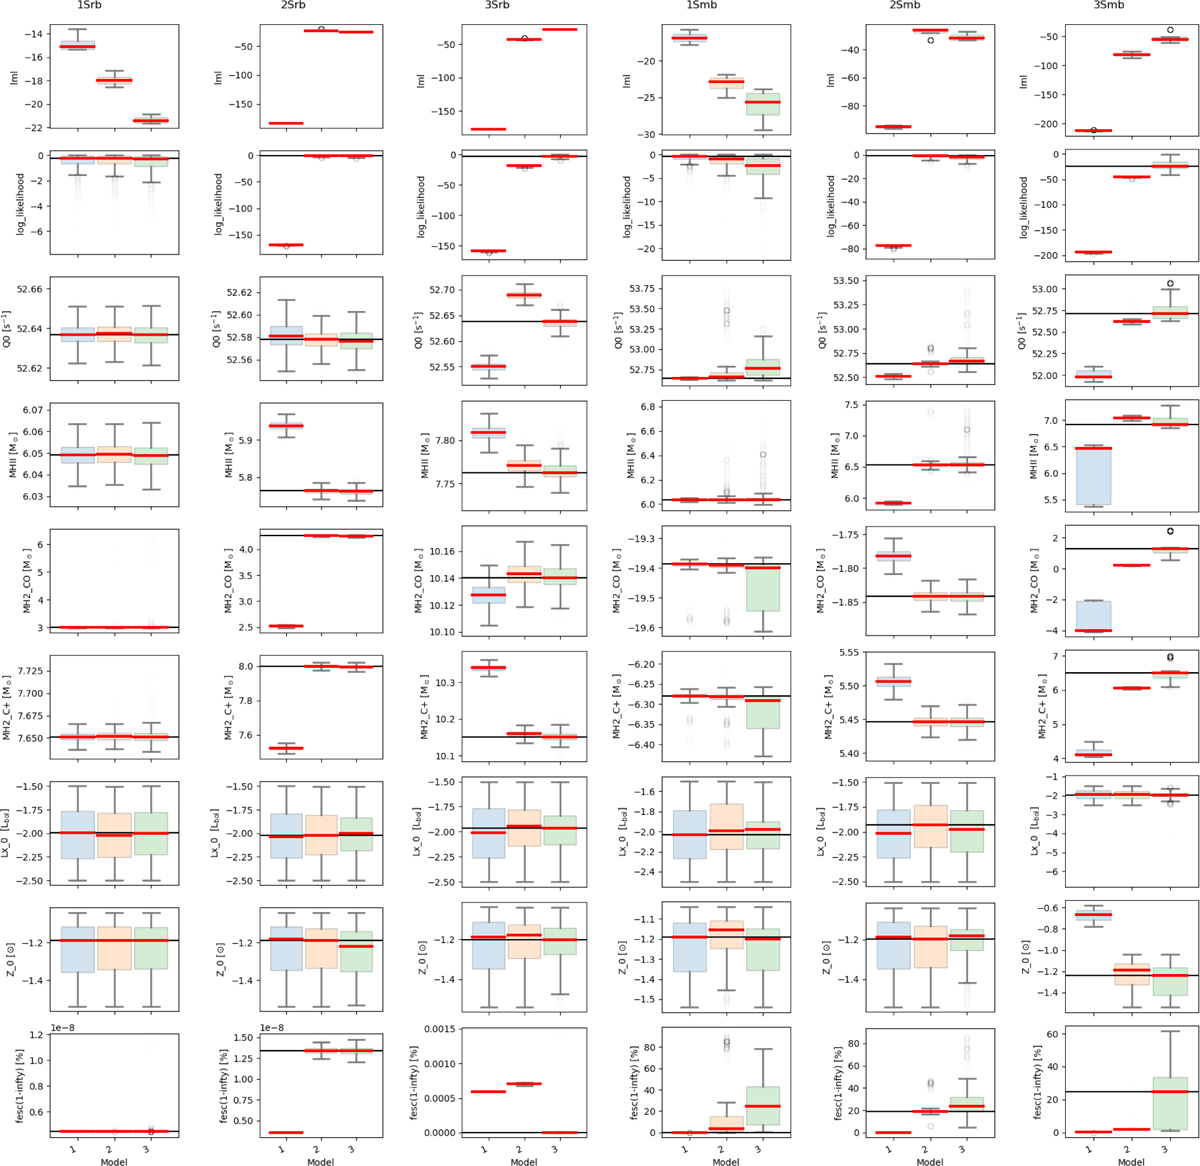
Output parameters for the benchmark model comparison. We show models with an input of one, two, and three sectors and for radiation-bounded (“rb”) or matter-bounded (“mb”) template models. Each plot shows a standard boxplot configuration with the median value in red, with the box spanning from the first to third quartile, and the horizontal gray bars extending to 1.5 times the inter-quartile range. Faint open circles show the data that extend beyond the horizontal gray bars. In each panel we show the results forcing the number of components from one to three. The two top panels show the marginal likelihood (“lml”) and the likelihood while the other panels below show several parameters (from top to bottom the number of ionizing photons, the mass of H+, the mass of H2 traced by CO, the mass of H2 traced by C+, the X-ray luminosity, the metallicity, and the escape fraction of ionizing photons). The horizontal lines show the expected value, except for the marginal likelihood where it indicates the highest value.
Current usage metrics show cumulative count of Article Views (full-text article views including HTML views, PDF and ePub downloads, according to the available data) and Abstracts Views on Vision4Press platform.
Data correspond to usage on the plateform after 2015. The current usage metrics is available 48-96 hours after online publication and is updated daily on week days.
Initial download of the metrics may take a while.