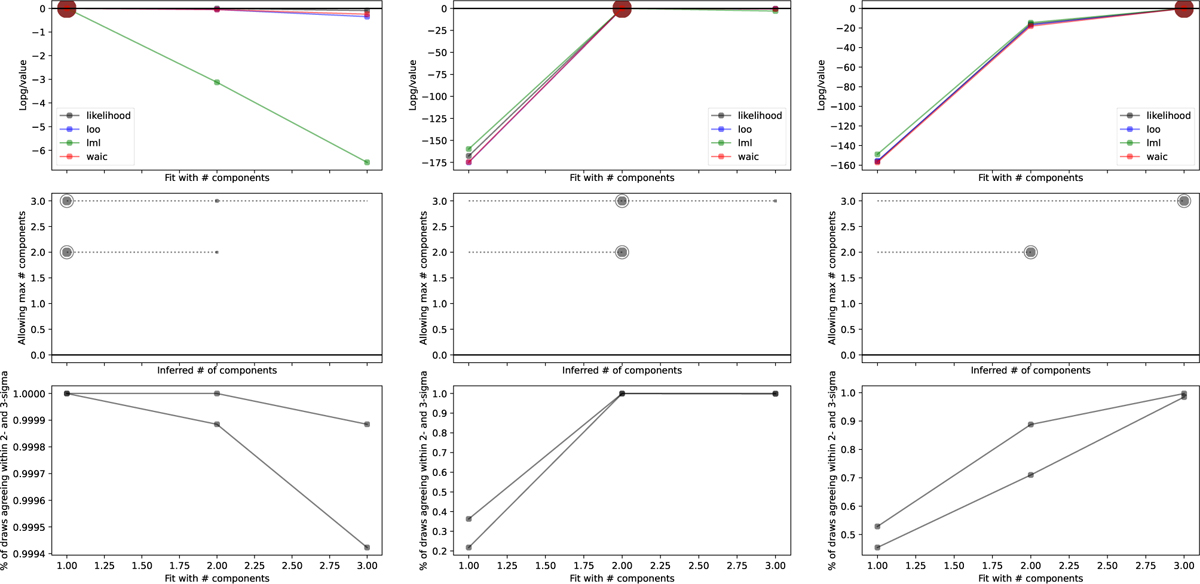
Fig. 8
Download original image
Model comparison to estimate the number of sectors required. We show models with an input of one, two, and three sectors from left to right. In the top panel we show the log values of LOO, WAIC, and the SMC marginal likelihood (“lml”) for MCMC runs with a number of sectors from one to three. In the middle panel we show the likelihood weights (not to be confused with the mixing weight) of each sector when the number of sectors is allowed to vary. Each horizontal line corresponds to a model with the number of sectors allowed to vary up to two or three. For each horizontal line, the filled circles show the inferred weight and the circled one highlights the number of sectors with the largest weight. In the bottom panel we show the fraction of draws that agree with the observed value within 2- and 3-σ.
Current usage metrics show cumulative count of Article Views (full-text article views including HTML views, PDF and ePub downloads, according to the available data) and Abstracts Views on Vision4Press platform.
Data correspond to usage on the plateform after 2015. The current usage metrics is available 48-96 hours after online publication and is updated daily on week days.
Initial download of the metrics may take a while.