Fig. 6
Download original image
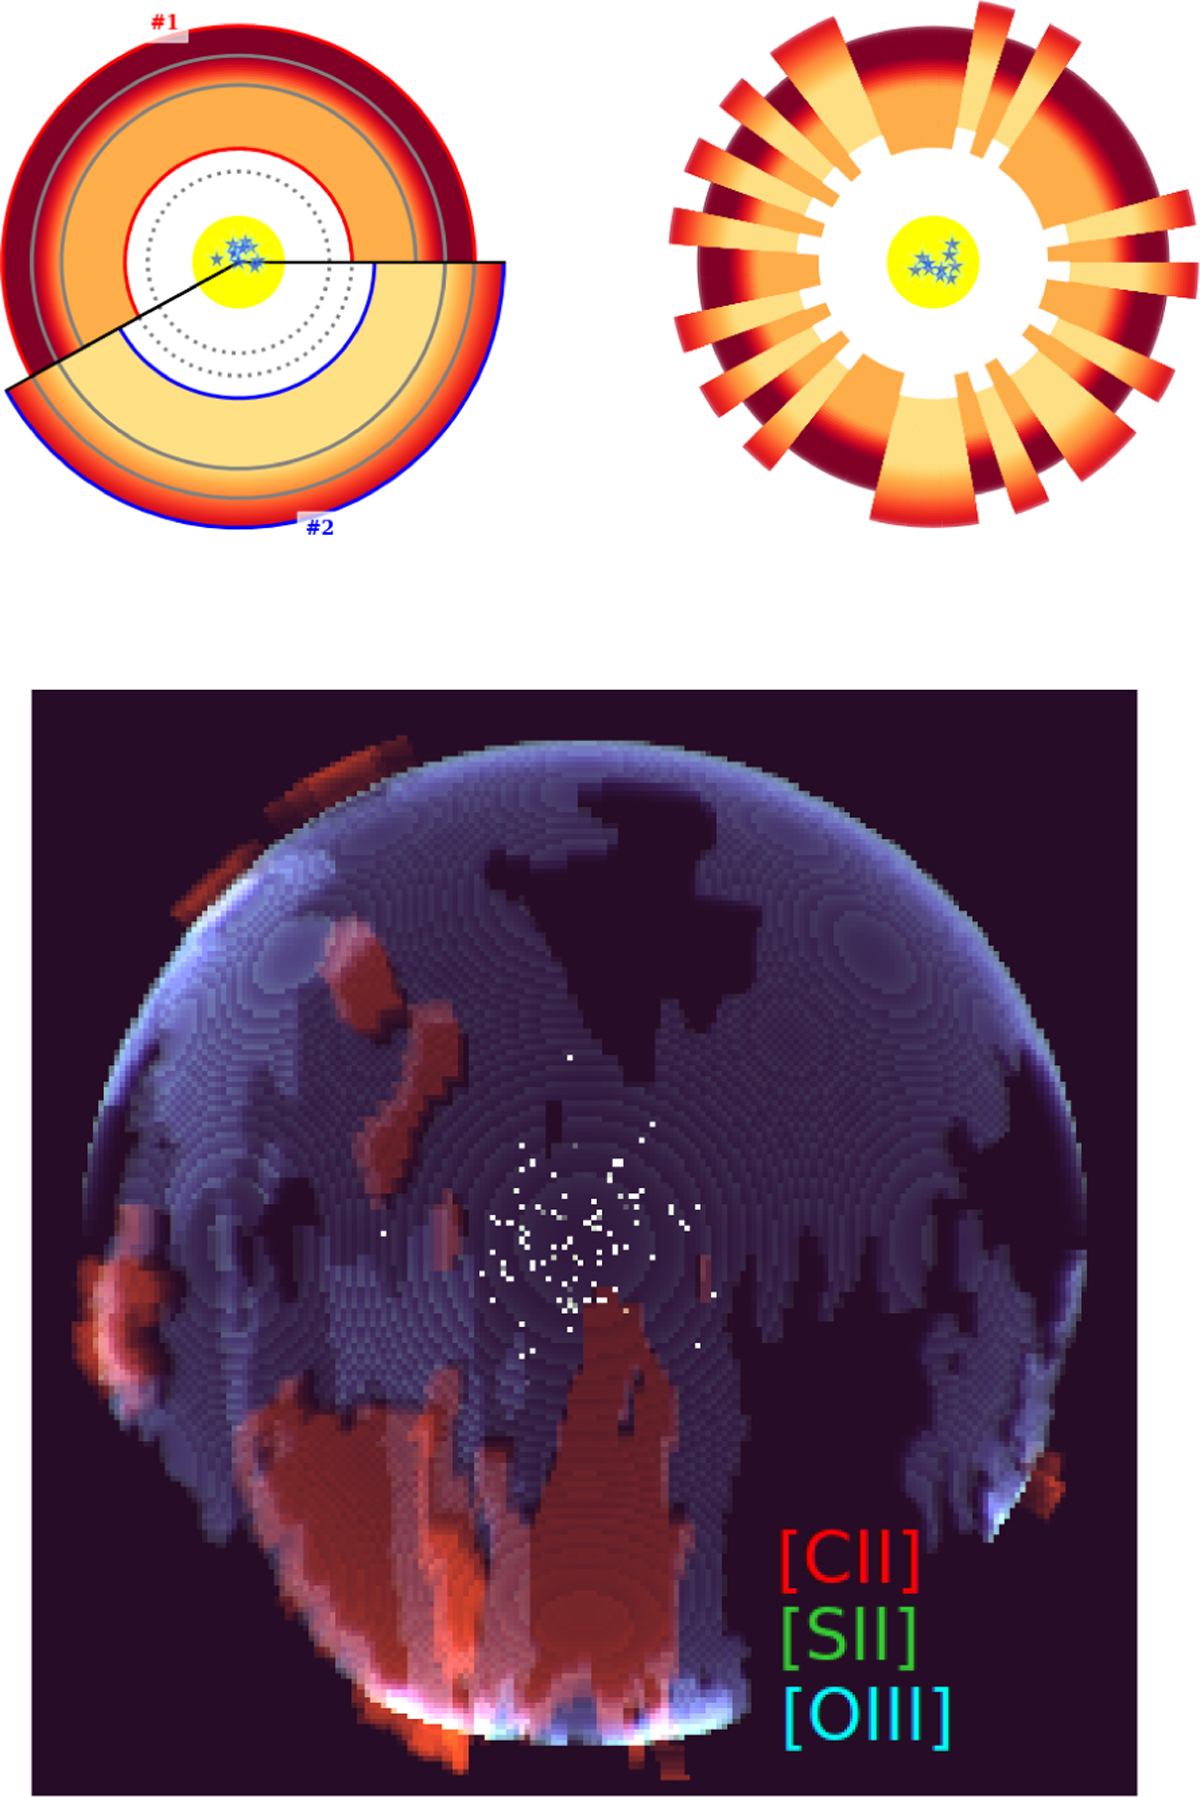
Configuration of inferred sectors for an example model. Top: the left plot shows the integrated covering factors while the right plot shows the same topology but with a different, random, geometry. The color scales from yellow to red as the gas volume density increases. Different inner radii indicate different ionization parameter (U) values, with dotted arcs showing U = 0, 1, …. The gray arcs show the photoionization and photodissociation fronts. The depth is not drawn to scale. Bottom: sectors are distributed randomly in 3D according to their relative covering factors and then projected in 2D. Screening/extinction effects are ignored. Stars are added for visual purposes only.
Current usage metrics show cumulative count of Article Views (full-text article views including HTML views, PDF and ePub downloads, according to the available data) and Abstracts Views on Vision4Press platform.
Data correspond to usage on the plateform after 2015. The current usage metrics is available 48-96 hours after online publication and is updated daily on week days.
Initial download of the metrics may take a while.