Fig. 5
Download original image
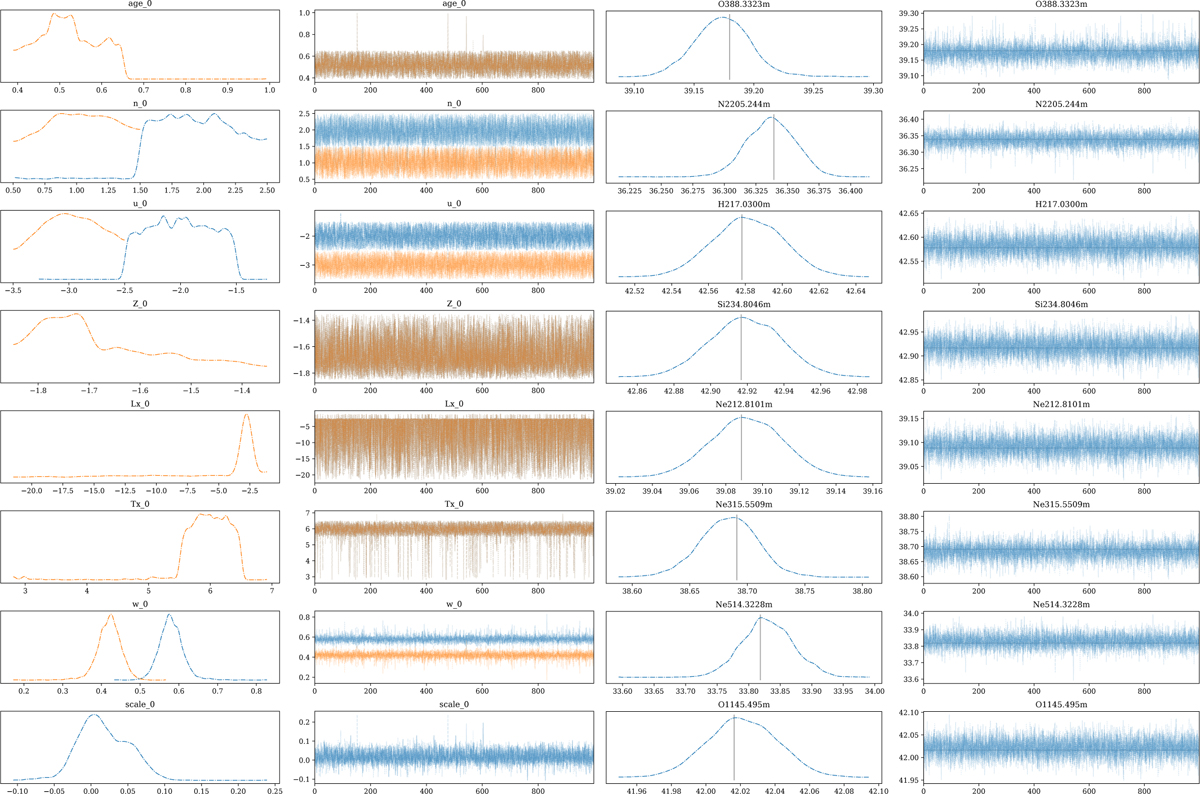
Example of the posterior distributions for the primary parameters (two leftmost columns) and for the observations (two rightmost columns). For each quantity, the left plot shows the PDF (with the vertical line indicating the reference measured value for observations), and the right plot shows the sequence of samples. For these plots individual jobs are combined. We note that some parameters have been forced to have identical values for the two components.
Current usage metrics show cumulative count of Article Views (full-text article views including HTML views, PDF and ePub downloads, according to the available data) and Abstracts Views on Vision4Press platform.
Data correspond to usage on the plateform after 2015. The current usage metrics is available 48-96 hours after online publication and is updated daily on week days.
Initial download of the metrics may take a while.