Fig. 20
Download original image
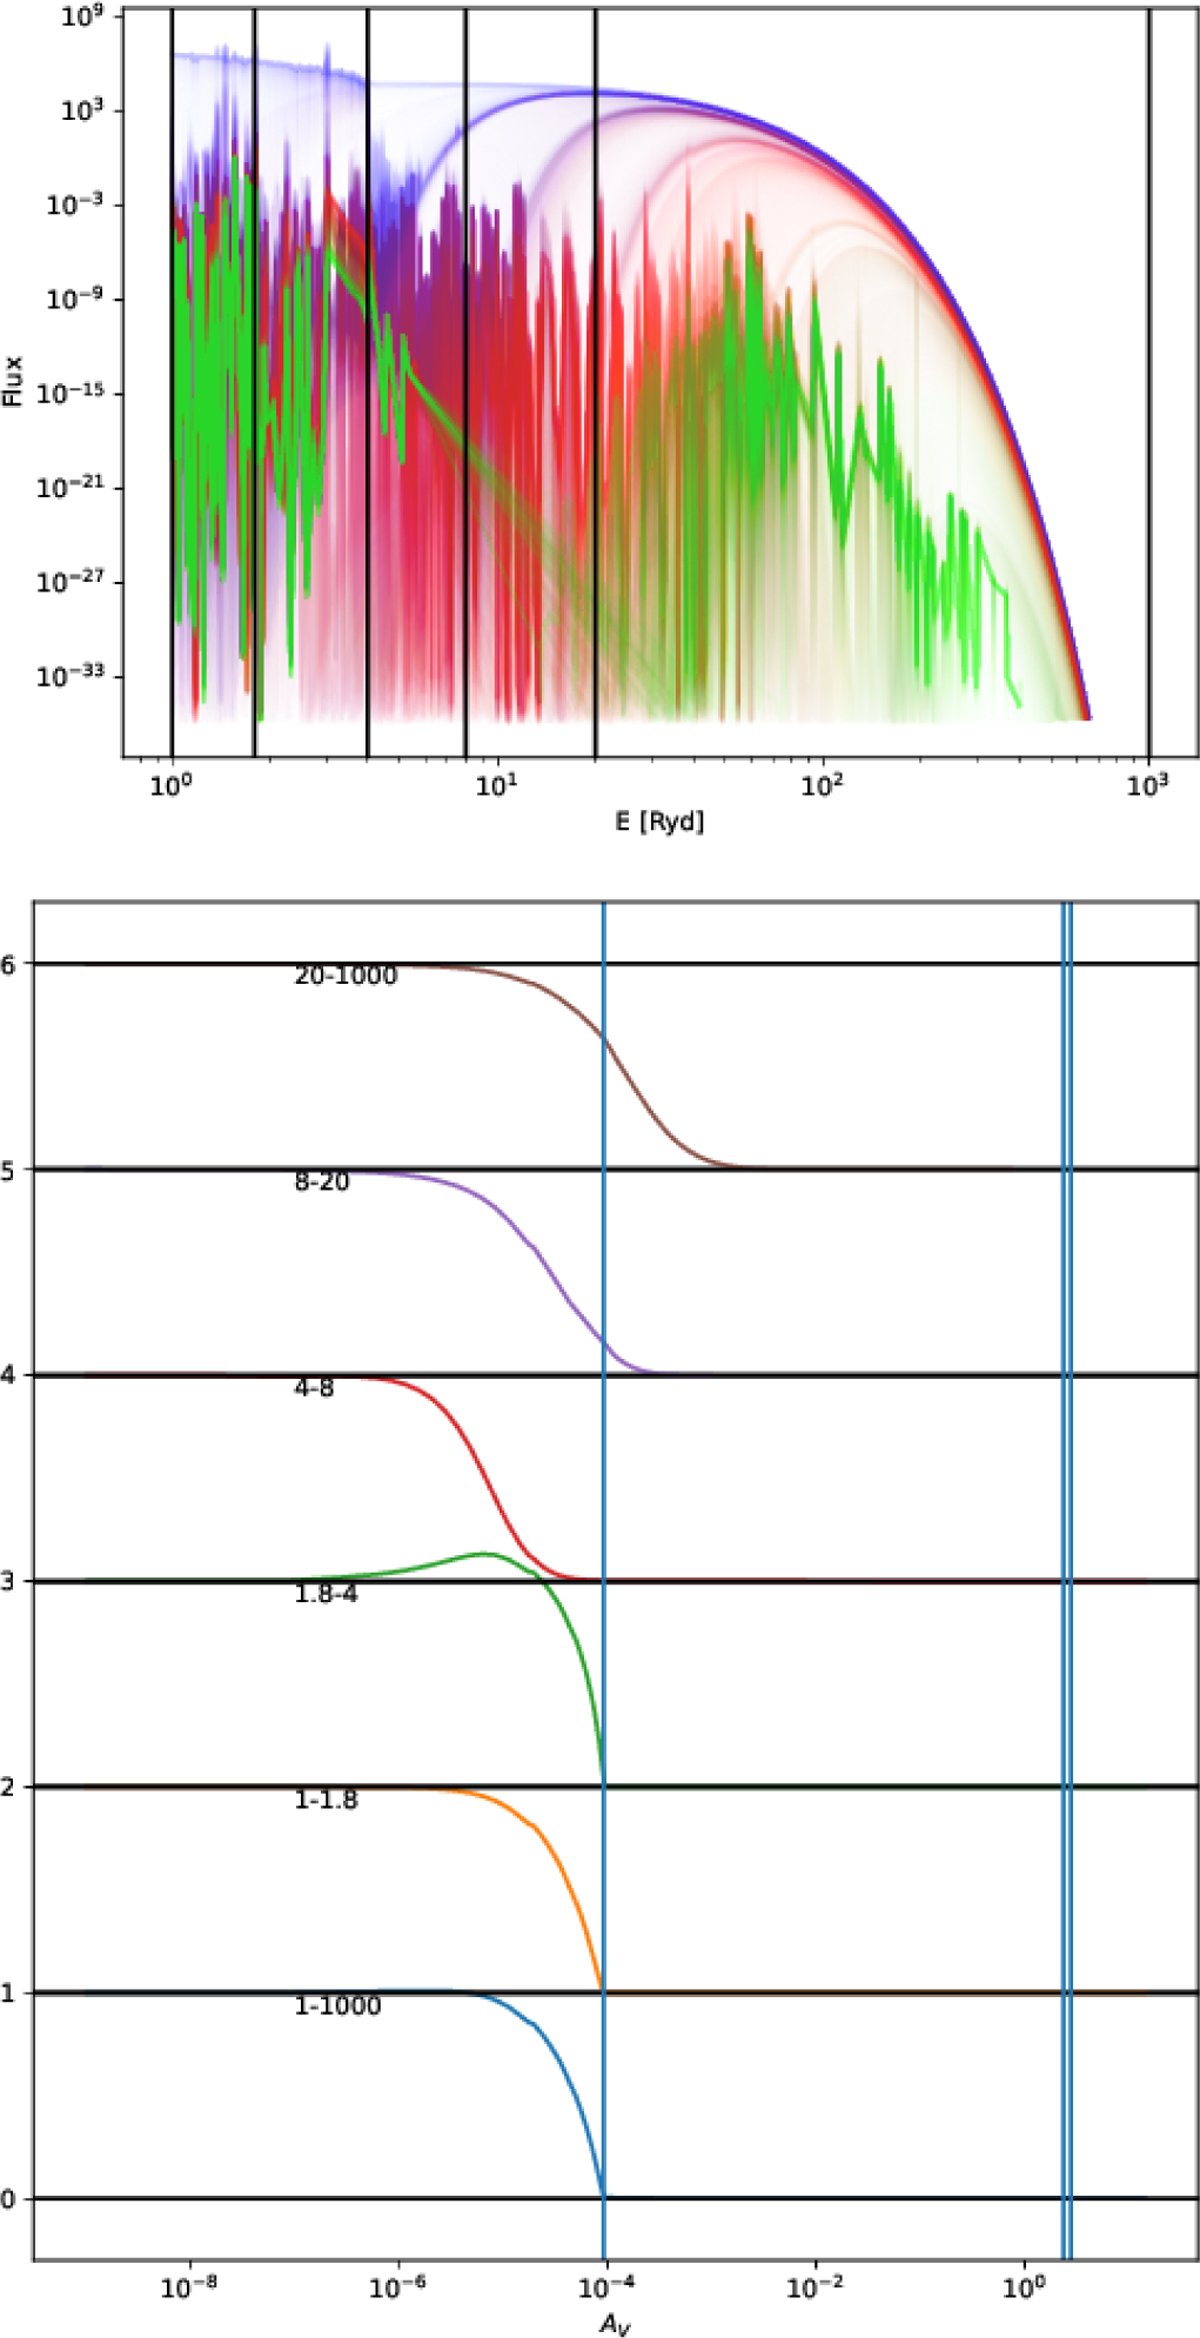
Absorption of the ionizing radiation throughout the gas slab. Top: shape of the radiation field spectrum for each zone calculated in Cloudy for the radiation-bounded sector of model MNM, from the illuminated edge of the cloud (blue) to the last zone (green). The vertical lines show the 1, 1.8, 4, 8, 20, and 2000 Ryd energy values. The spectrum is heavily and rapidly absorbed right above 4 Ryd due to He2+ absorption. Bottom: evolution of the integrated flux across the cloud depth (normalized to the value at the illuminated edge) for different energy ranges in Rydberg. The vertical lines show the ionization front, PDR, and C/CO transitions from left to right. The radiation field >20 Ryd is able to penetrate in the neutral gas (top panel) but this contributes little to the total escape fraction (bottom panel). The kink for the 1.8−4 Ryd range is due to secondary ionization following He recombination.
Current usage metrics show cumulative count of Article Views (full-text article views including HTML views, PDF and ePub downloads, according to the available data) and Abstracts Views on Vision4Press platform.
Data correspond to usage on the plateform after 2015. The current usage metrics is available 48-96 hours after online publication and is updated daily on week days.
Initial download of the metrics may take a while.