Fig. 18
Download original image
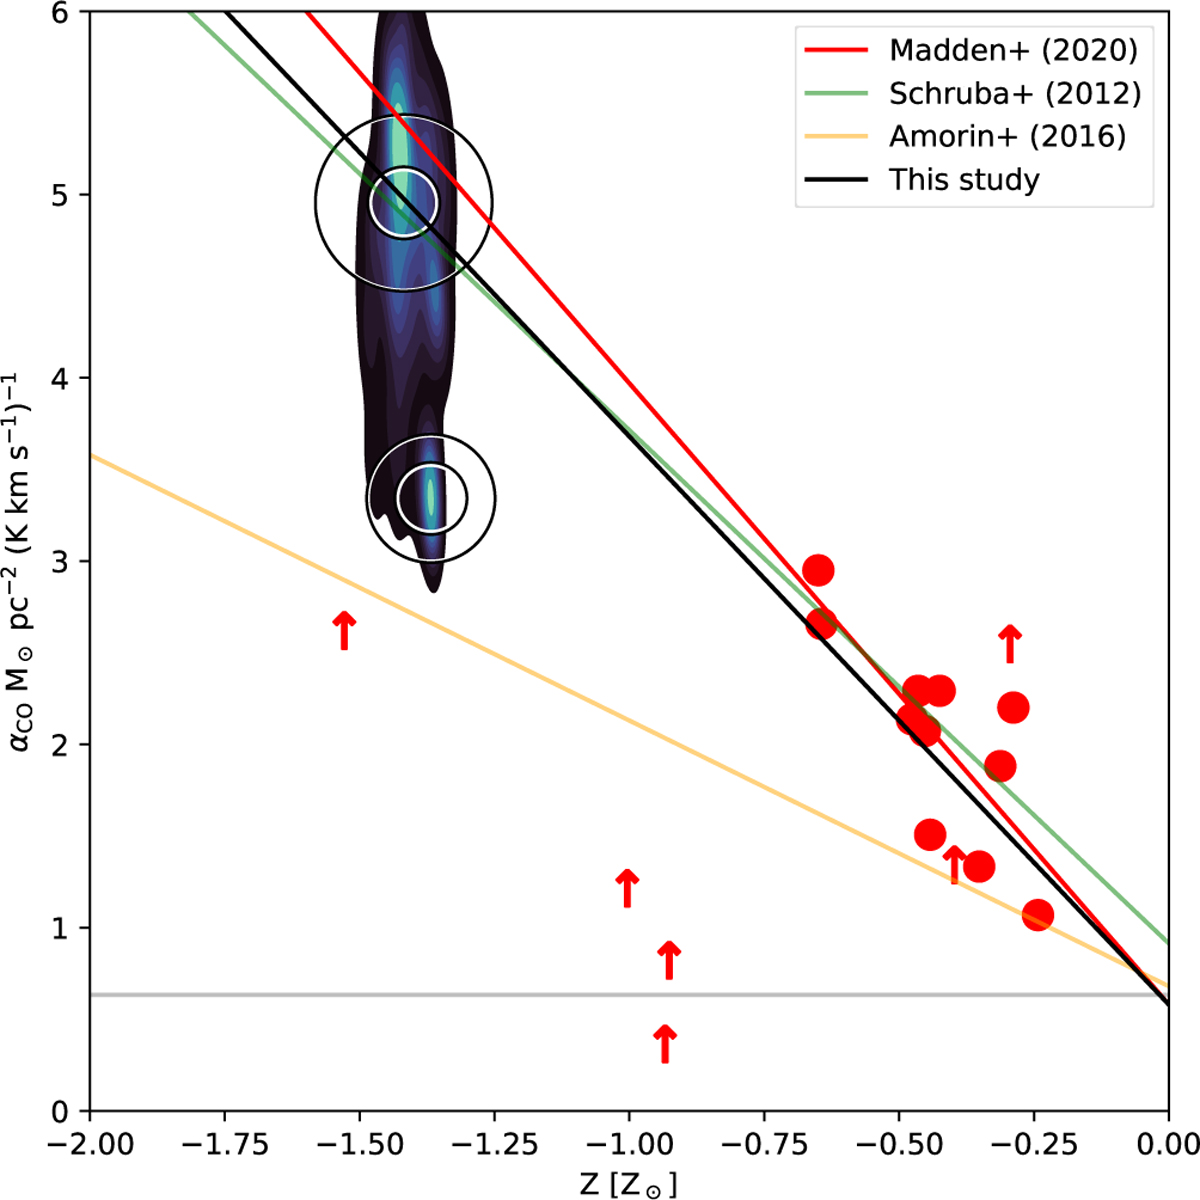
Variation of αCO as a function of metallicity compared to Schruba et al. (2012); Sandstrom et al. (2013); Amorín et al. (2016); Madden et al. (2020). The red data points and upper limits are from Madden et al. (2020). We also show on top the most likely solution (empty black circle with the gray circle indicating the standard deviation) with M(H2) = 105.4 M⊙ and CO 3500 times fainter than in Zhou et al. (2021) and on bottom the secondary, less likely, solution with 107 M⊙ and CO in agreement with Zhou et al. (2021).
Current usage metrics show cumulative count of Article Views (full-text article views including HTML views, PDF and ePub downloads, according to the available data) and Abstracts Views on Vision4Press platform.
Data correspond to usage on the plateform after 2015. The current usage metrics is available 48-96 hours after online publication and is updated daily on week days.
Initial download of the metrics may take a while.