Open Access
Fig. 17
Download original image
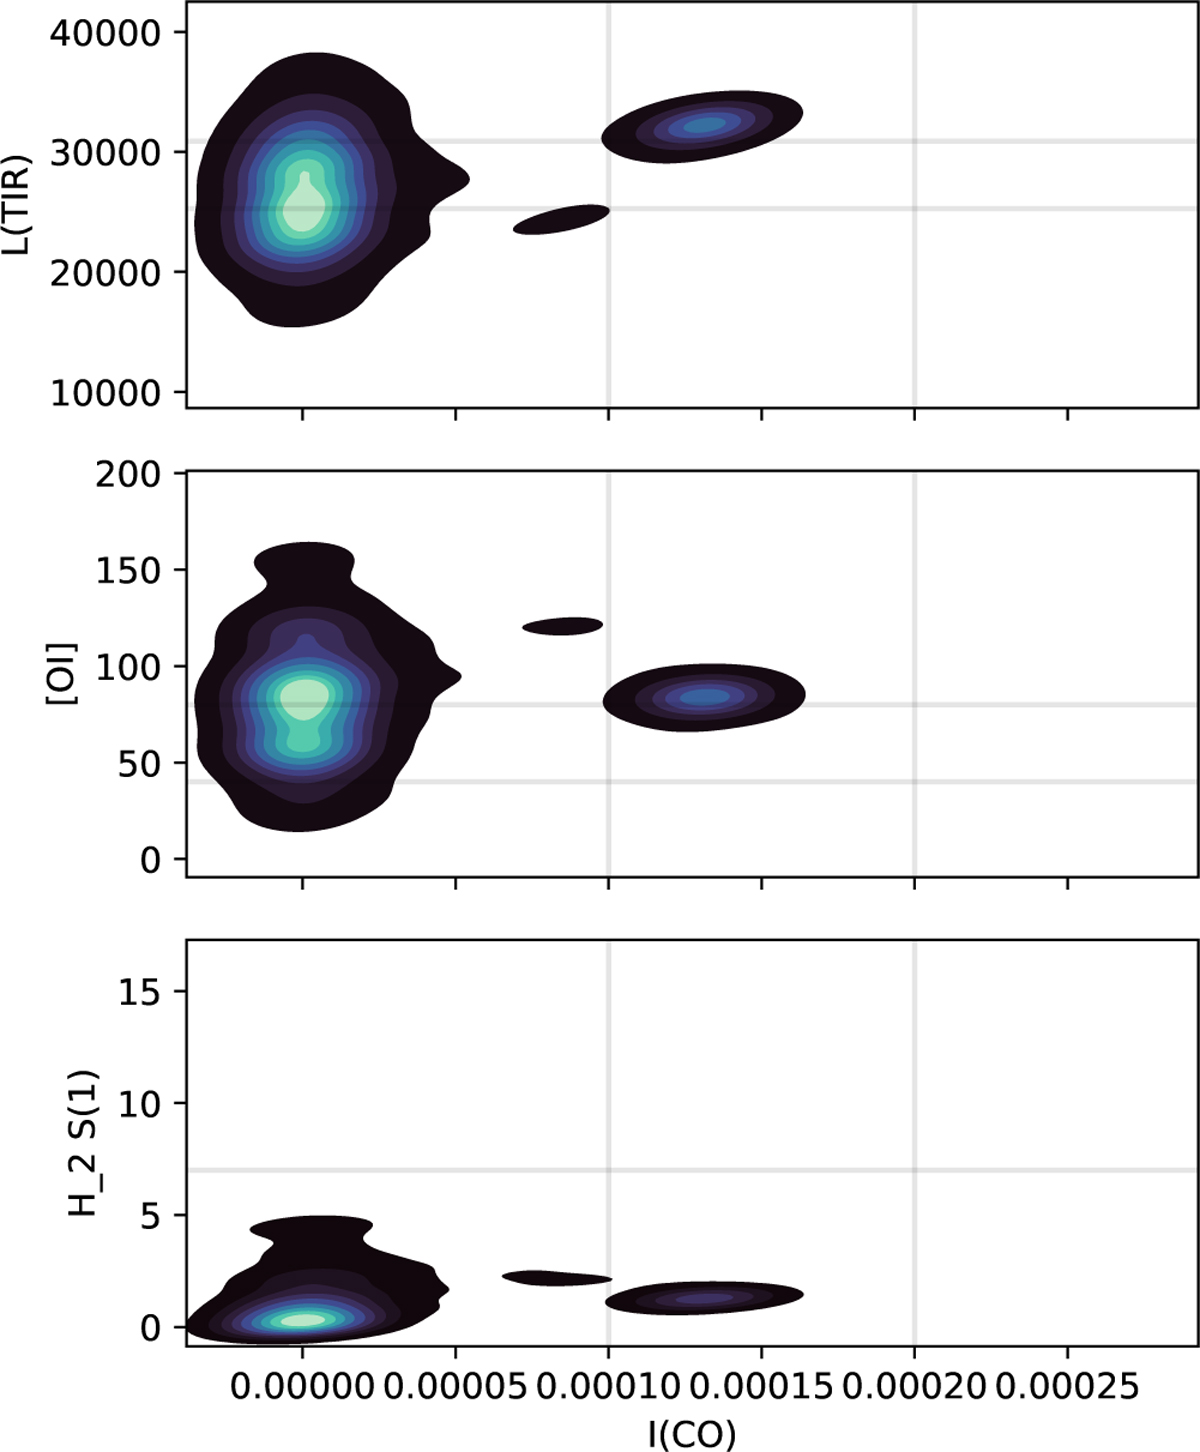
Variation of the observed fluxes as a function of I(CO). From top to bottom we show the IR flux, the [O i] flux, and the H2 S(l) line flux. Fluxes are scaled to 4.56 × l036 ergs−1. Horizontal and vertical lines show the observed uncertainties or the upper limit (for H2).
Current usage metrics show cumulative count of Article Views (full-text article views including HTML views, PDF and ePub downloads, according to the available data) and Abstracts Views on Vision4Press platform.
Data correspond to usage on the plateform after 2015. The current usage metrics is available 48-96 hours after online publication and is updated daily on week days.
Initial download of the metrics may take a while.