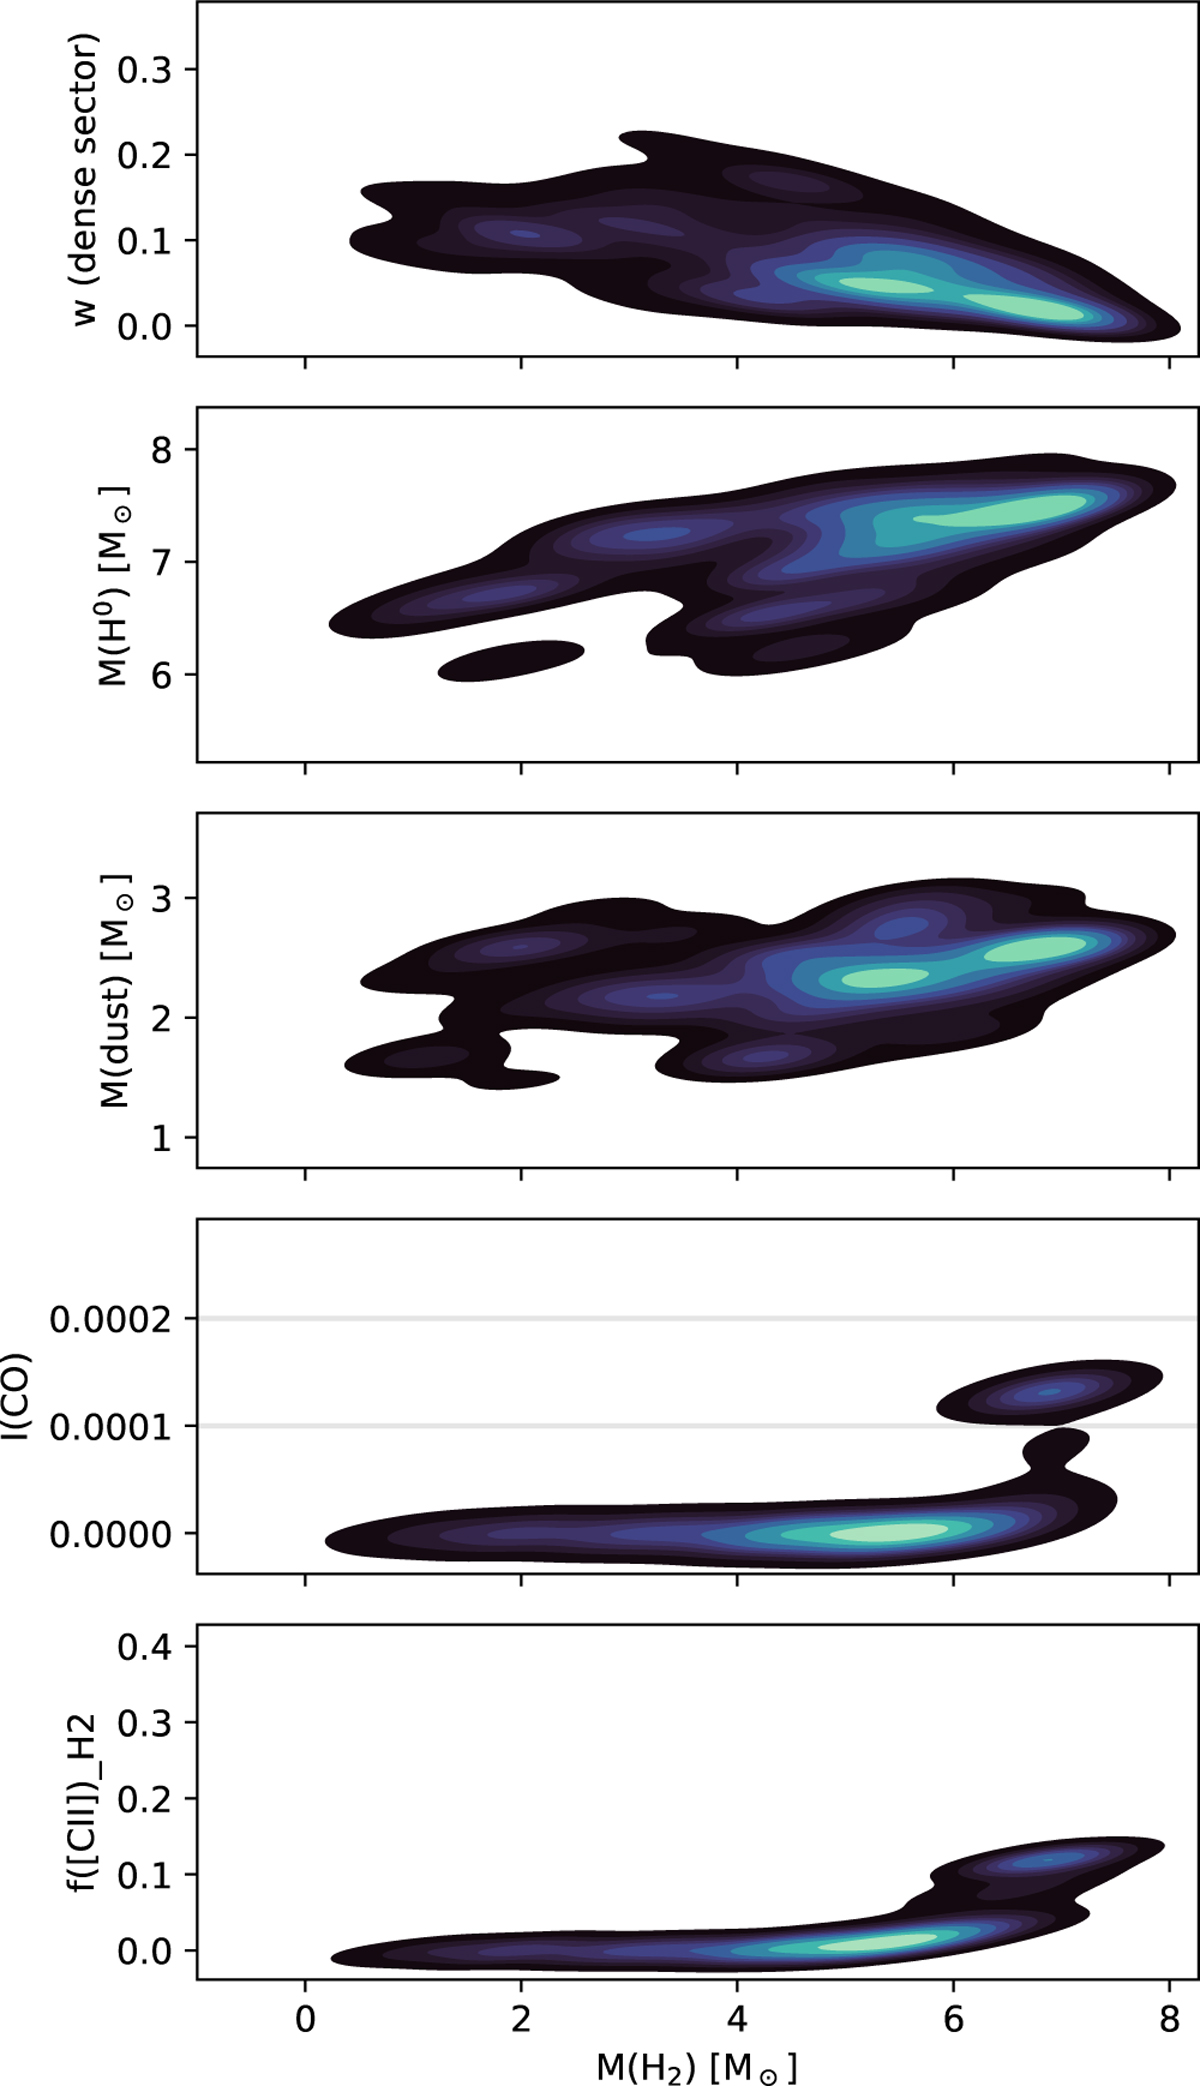
Fig. 16
Download original image
Properties of the molecular sector in model MNM. From top to bottom, we show as a function of the total predicted H2 mass, the mixing weight of the molecular sector, the mass of H0, of dust, the CO(1–0) intensity (scaled to 4.56 × 1036 erg s−1; with the horizontal lines showing the observed range in Zhou et al. 2021), and the fraction of [C ii] originating from the molecular sector.
Current usage metrics show cumulative count of Article Views (full-text article views including HTML views, PDF and ePub downloads, according to the available data) and Abstracts Views on Vision4Press platform.
Data correspond to usage on the plateform after 2015. The current usage metrics is available 48-96 hours after online publication and is updated daily on week days.
Initial download of the metrics may take a while.