Open Access
Fig. 12
Download original image
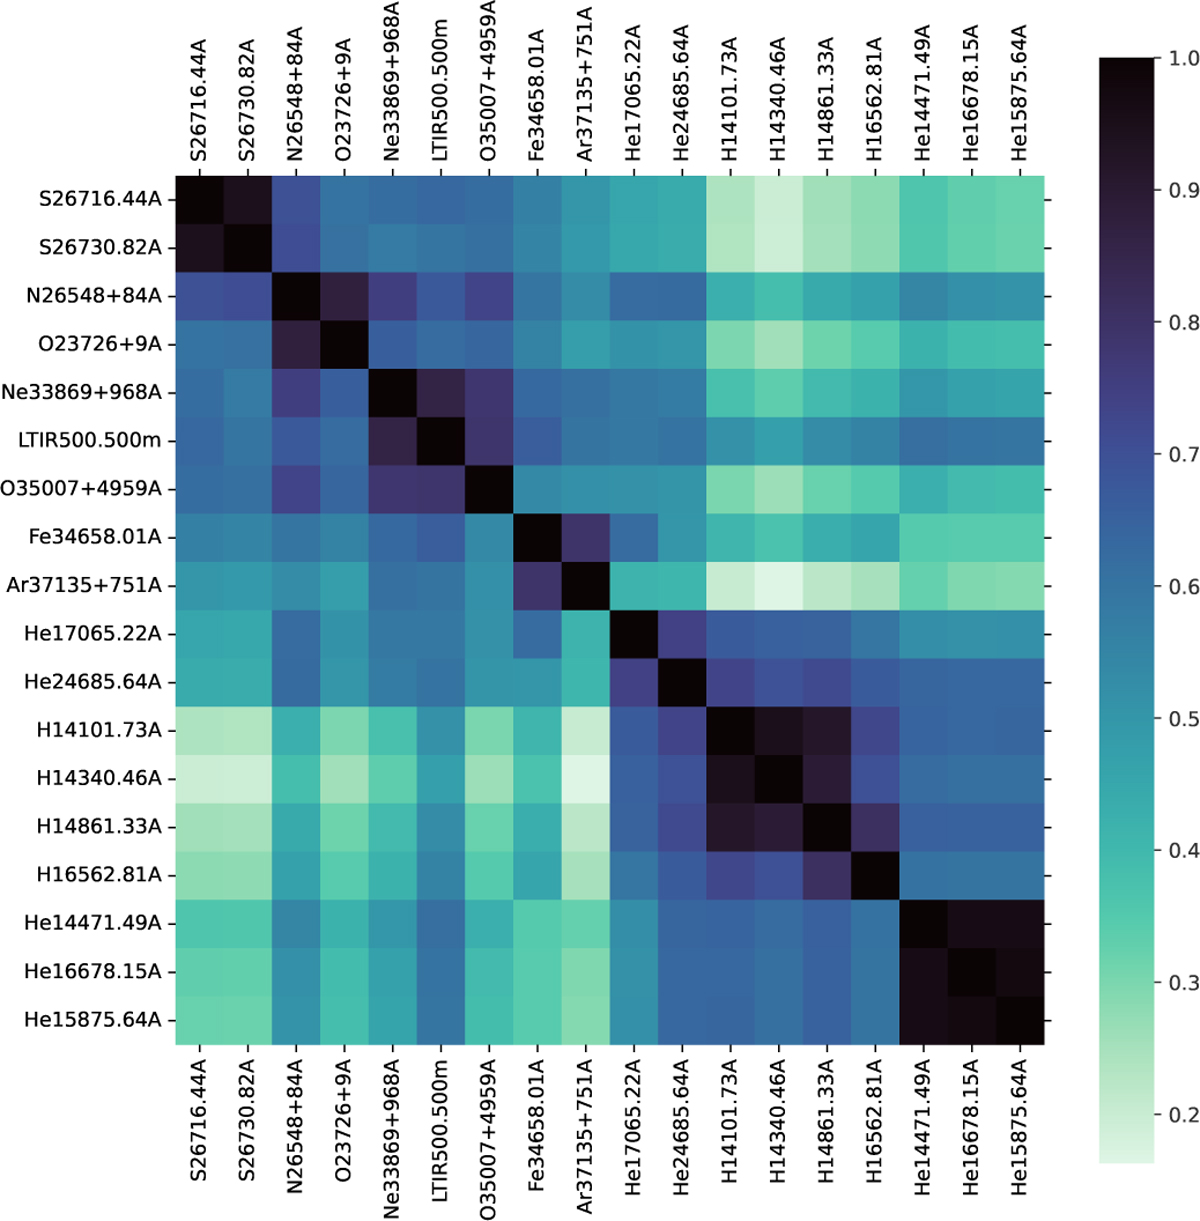
Map of the correlation coefficients between predicted observations for a benchmark run. Here one can see that, according to the input grid, most H lines trace the same parameters around the solution (the same applies to He or [S ii]).
Current usage metrics show cumulative count of Article Views (full-text article views including HTML views, PDF and ePub downloads, according to the available data) and Abstracts Views on Vision4Press platform.
Data correspond to usage on the plateform after 2015. The current usage metrics is available 48-96 hours after online publication and is updated daily on week days.
Initial download of the metrics may take a while.