Fig. 8
Download original image
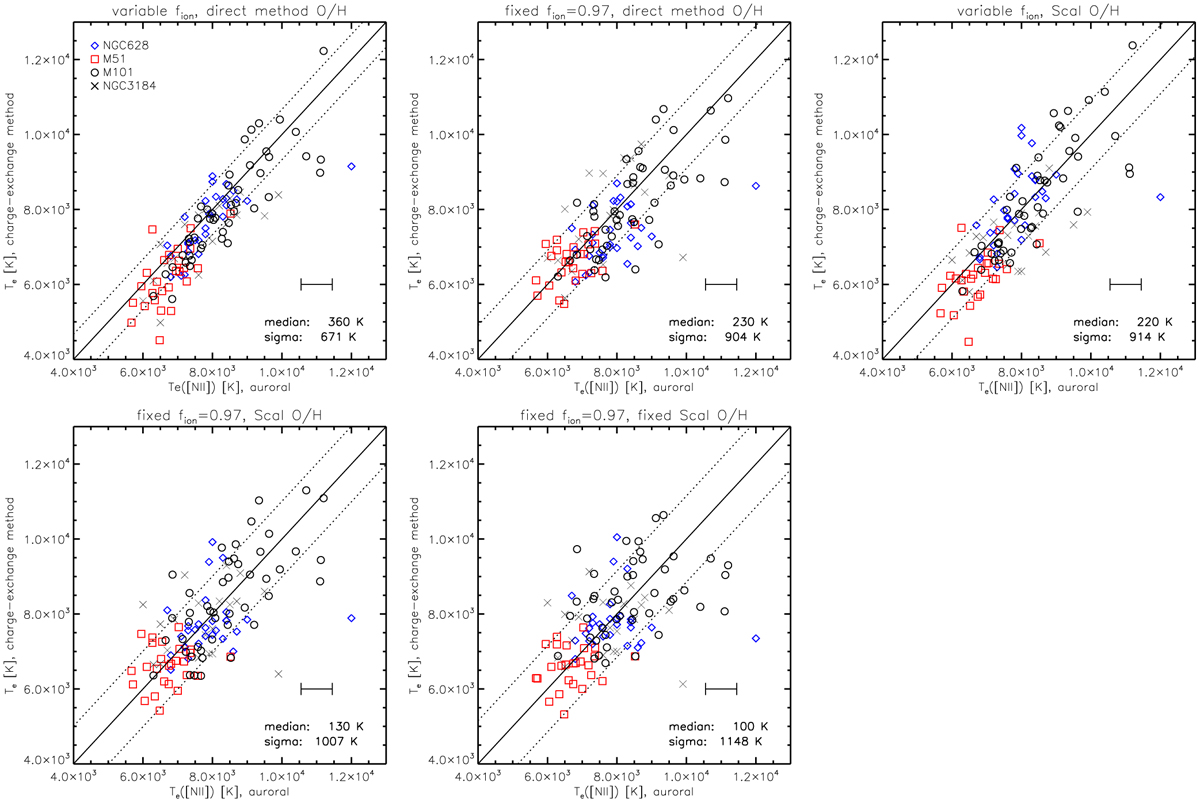
Comparison of the modeled Te as a function of Te measured by CHAOS using the [N ii] λ5755 auroral line. Each panel makes a different assumption about how the value of fion and 12+log(O/H) are calculated. The top-left plot represents the best-case scenario, where we vary fion as a function of [S iii]/[S ii] and use metallicities calculated from the direct method. This shows the lowest systematic scatter between Te values of 662 K. The other two plots in the top row each relax one of the assumptions, assuming either a fixed fion = 0.97 (top center) or a metallicity calculated from strong line techniques (top right). Both have an increased scatter of ~900 K. The two plots in the bottom row further relax the assumptions, resulting in further inaccuracies. This test includes the assumptions of both a fixed fion = 0.97 and a strong-line metallicity (~950 K; bottom right) and a fixed fion = 0.97 and a fixed global metallicity per galaxy (~1100 K; bottom center). A one-to-one relation (solid line) and 1σ scatter (dotted lines) are shown in each plot, and the median and standard deviation are listed. While relaxing our assumptions does result in increased scatter, the overall agreement remains good. We adopt the assumptions that go into the top-right figure (a variable fon and a strong line 12+log(O/H)) for the model that we apply in this work, as summarized in Sect. 4.3.
Current usage metrics show cumulative count of Article Views (full-text article views including HTML views, PDF and ePub downloads, according to the available data) and Abstracts Views on Vision4Press platform.
Data correspond to usage on the plateform after 2015. The current usage metrics is available 48-96 hours after online publication and is updated daily on week days.
Initial download of the metrics may take a while.