Fig. 7
Download original image
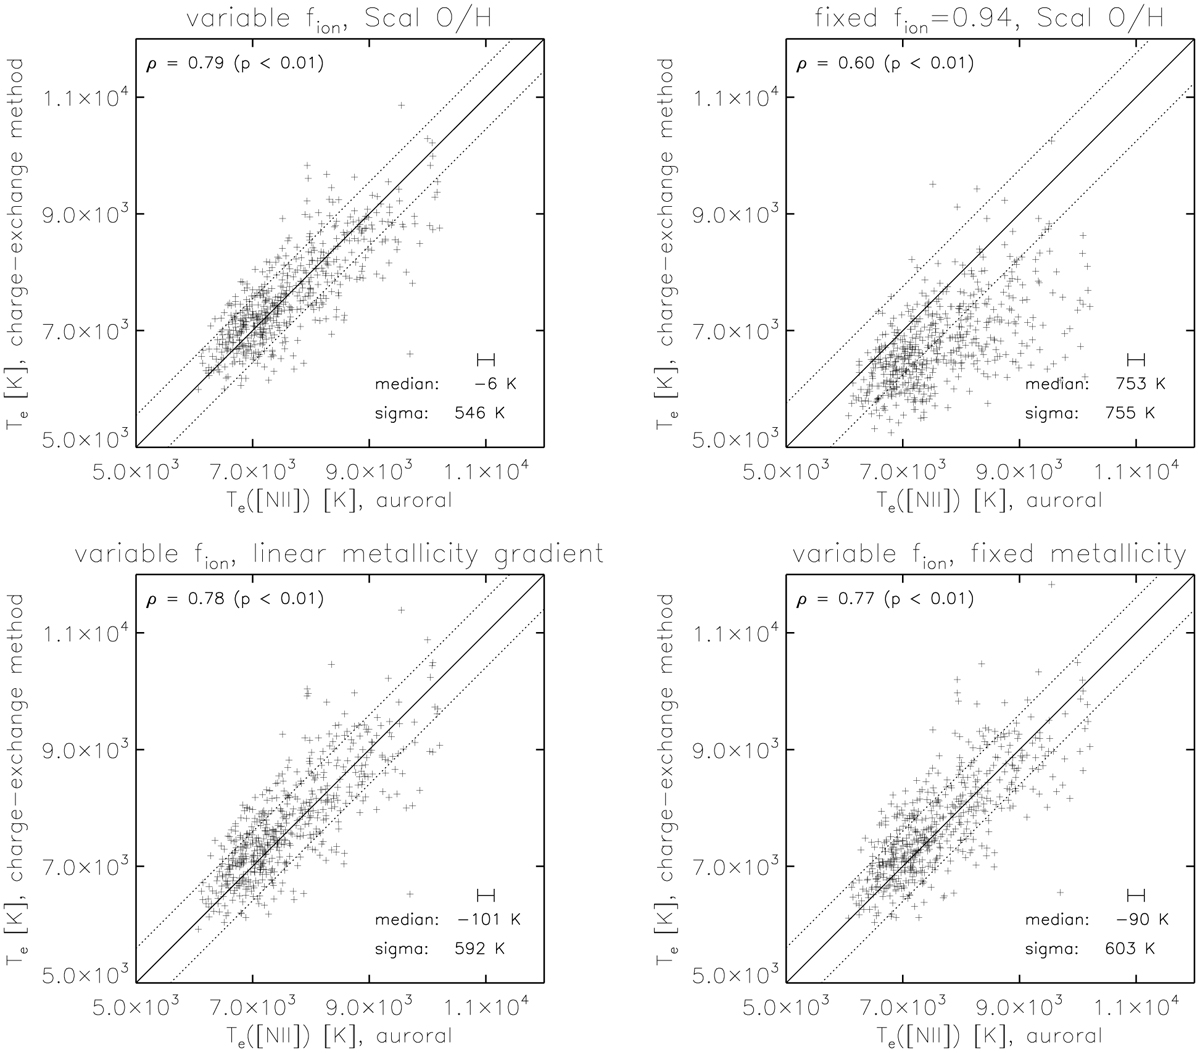
Comparison of the modeled Te as a function of the Te measured within PHANGS-MUSE using the [N ii] λ5755 auroral line. Each panel makes different assumptions about how the values of fion or 12+log(O/H) are calculated. For each panel we show a one-to-one relation (solid line) and 1σ relative scatter (dotted lines), as well as the Spearman’s rank correlation coefficient (ρ). Top left: demonstration of our adopted method (Sect. 4.3), where we use our empirical prescription for fion (Eq. (15)) and metallicities calculated from the strong line Scal method. We recover high correlations (ρ = 0.79) and systematic agreement within 6 K, with a scatter of 546 K. Relaxing various assumptions in our model increases the scatter. Top right: assuming a fixed fion = 0.94 (the median for the PHANGS-MUSE sample), which produces significantly higher scatter (~755 K) and clear deviations from the one-to-one relation. Bottom panels: with variable fion applied but our derivation of 12+log(O/H) relaxed, with either a linear radial gradient (left) or a fixed metallicity adopted for each galaxy (right). Both recover high correlation coefficients with moderately increased scatter (~600 K). This demonstrates the relative insensitivity to the input metallicity for this charge-exchange method of deriving Te.
Current usage metrics show cumulative count of Article Views (full-text article views including HTML views, PDF and ePub downloads, according to the available data) and Abstracts Views on Vision4Press platform.
Data correspond to usage on the plateform after 2015. The current usage metrics is available 48-96 hours after online publication and is updated daily on week days.
Initial download of the metrics may take a while.