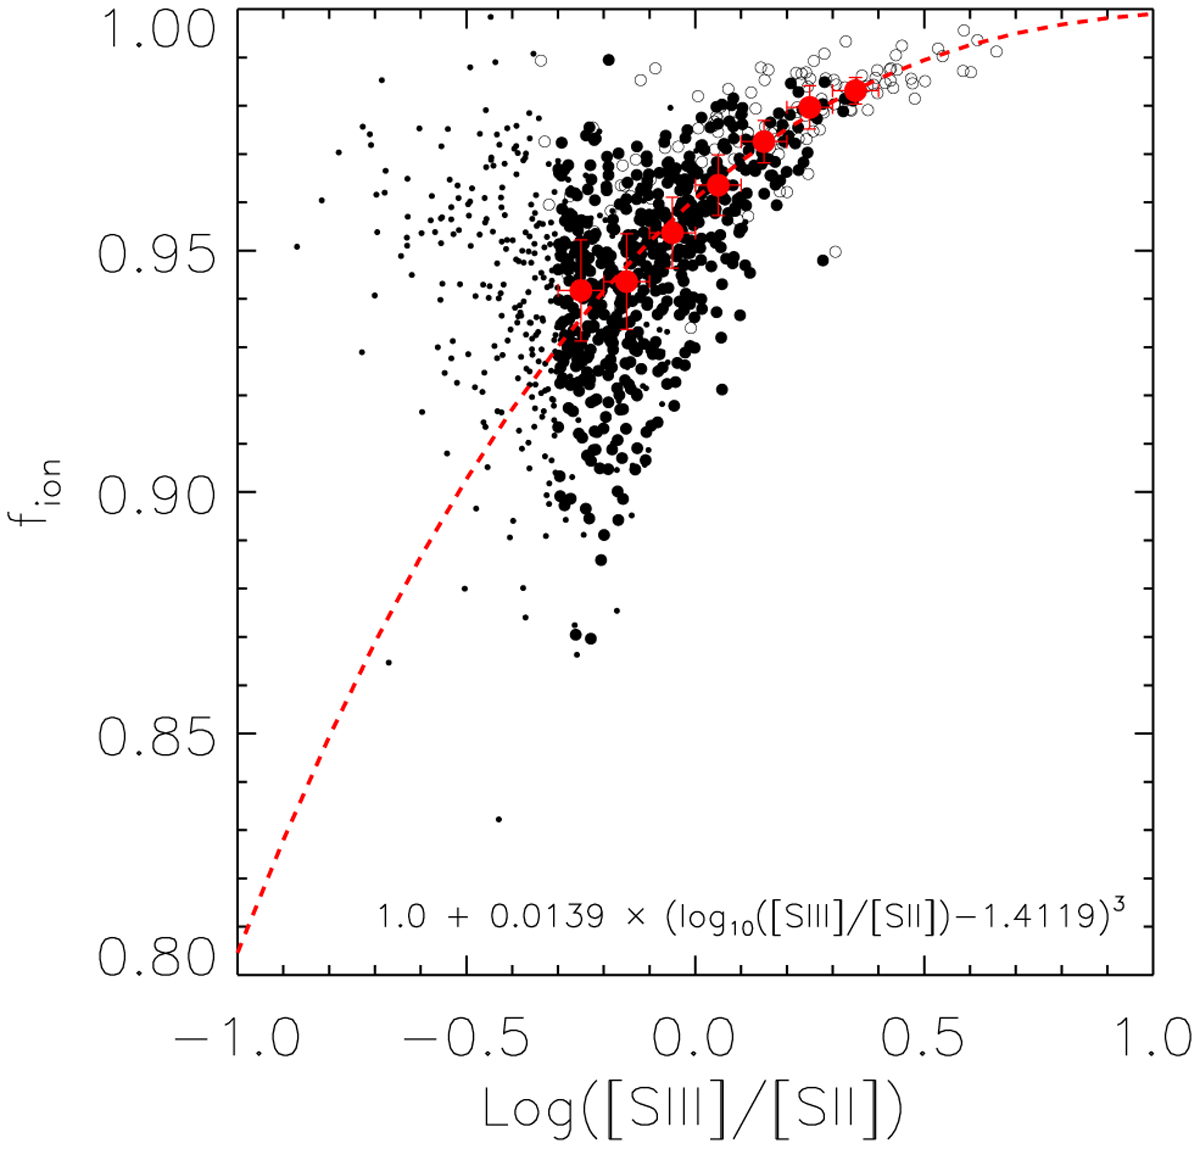
Fig. 6
Download original image
As in Fig. 1, fion modeled assuming the values of Te([N ii]) measured from direct detection of auroral lines in the PHANGS-MUSE Η ii region sample (points). This forms a continuous sequence with the Η ii regions in the CHAOS sample (open circles), but with a significantly more pronounced nonlinear trend. From the PHANGS-MUSE sample, we selected only regions with a more than 50% contrast against the DIG background and with [S iii]/[S ii] > 0.5 (filled circles). We then combined the PHANGS-MUSE and CHAOS samples to construct a binned median (red circles). We fit this with the functional form described in Eq. (15) (dashed red line) to determine our empirical relation for fion.
Current usage metrics show cumulative count of Article Views (full-text article views including HTML views, PDF and ePub downloads, according to the available data) and Abstracts Views on Vision4Press platform.
Data correspond to usage on the plateform after 2015. The current usage metrics is available 48-96 hours after online publication and is updated daily on week days.
Initial download of the metrics may take a while.