Fig. 4
Download original image
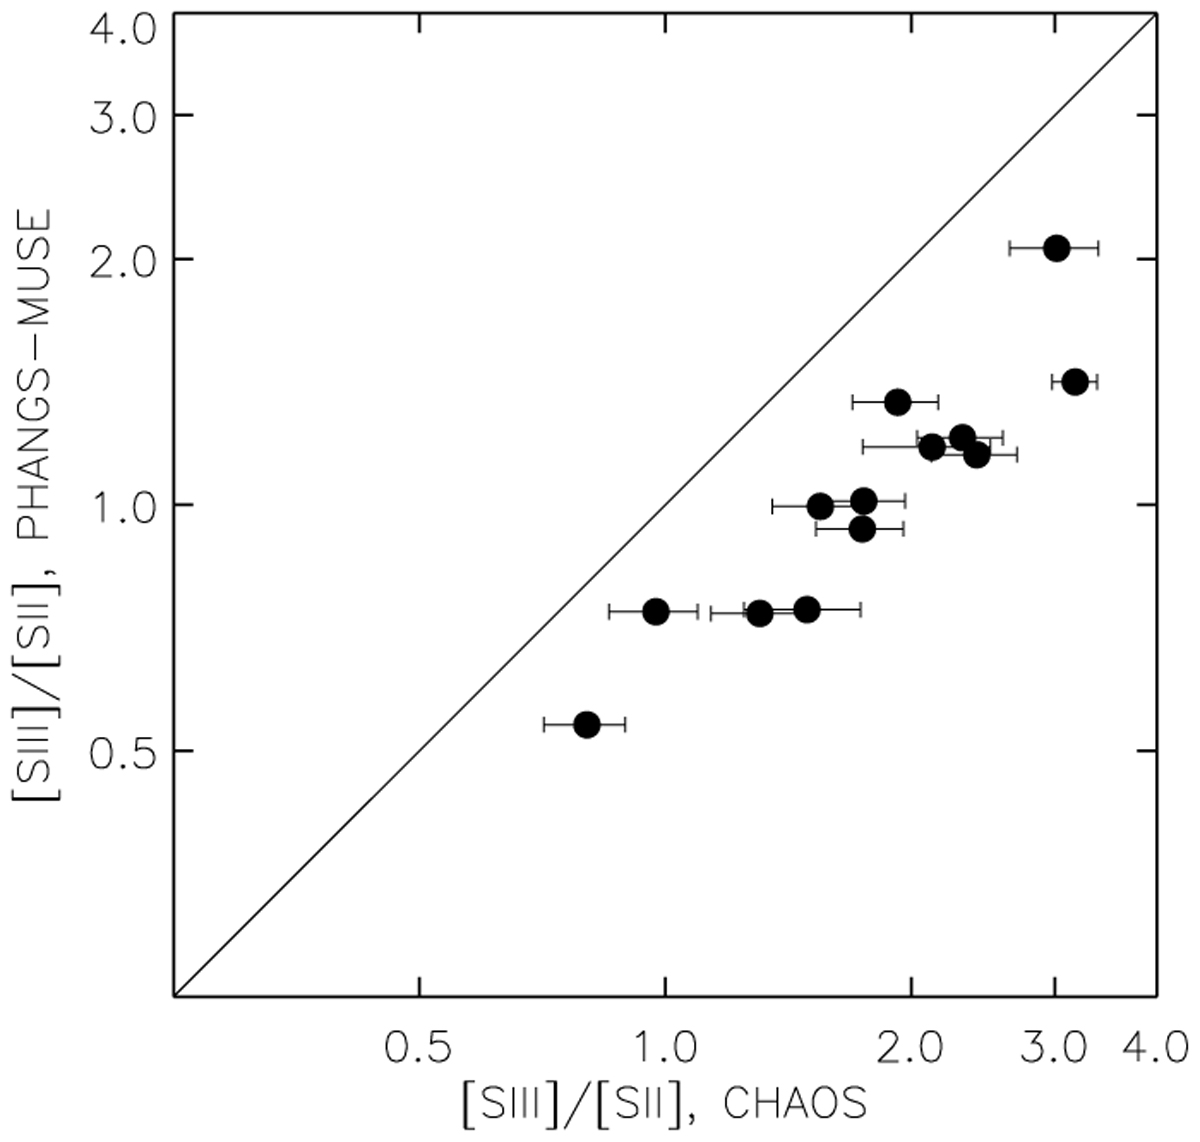
Comparison of the [S iii]/[S ii] line ratio measured across integrated Η ii region spectra from PHANGS-MUSE with the measurement obtained within the CHAOS 1″ slit for 13 H ii regions that overlap between the two surveys. Error bars are shown for both surveys, although the PHANGS errors are smaller than the symbols. The one-to-one line (black) shows that CHAOS systematically overestimates the line ratio by focusing on only the central brightest part of these extended Η ii regions, where the [S iii] emission is preferentially located. This demonstrates the challenges of applying such resolved measurements to broader Η ii region samples.
Current usage metrics show cumulative count of Article Views (full-text article views including HTML views, PDF and ePub downloads, according to the available data) and Abstracts Views on Vision4Press platform.
Data correspond to usage on the plateform after 2015. The current usage metrics is available 48-96 hours after online publication and is updated daily on week days.
Initial download of the metrics may take a while.