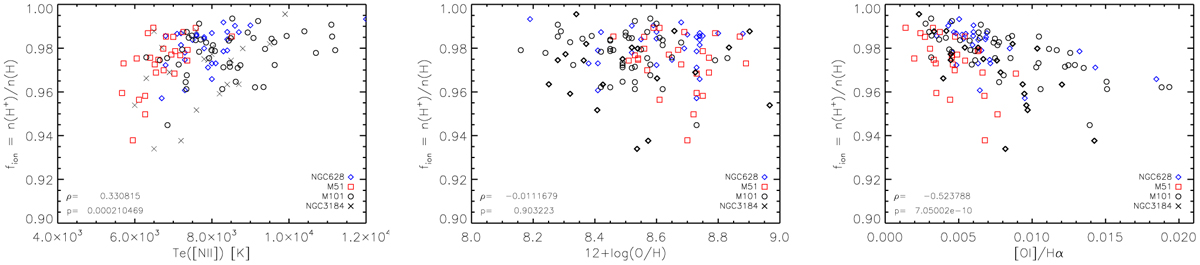
Fig. 3
Download original image
Correlating fion with the three input parameters (Te([Ν ii]), 12+log(O/H), and [Ο i]/Ηα) for each H ii region in the CHAOS sample. Each of the four galaxies is shown with separate symbols, and the Spearman’s rank correlation coefficient (ρ) and its significance (p) are shown in each figure. The fion variations correlate most strongly with changes in [Ο i]/Ηα, but show a weaker correlation than the trends with [S iii]/[S ii] in Fig. 1.
Current usage metrics show cumulative count of Article Views (full-text article views including HTML views, PDF and ePub downloads, according to the available data) and Abstracts Views on Vision4Press platform.
Data correspond to usage on the plateform after 2015. The current usage metrics is available 48-96 hours after online publication and is updated daily on week days.
Initial download of the metrics may take a while.