Fig. 17
Download original image
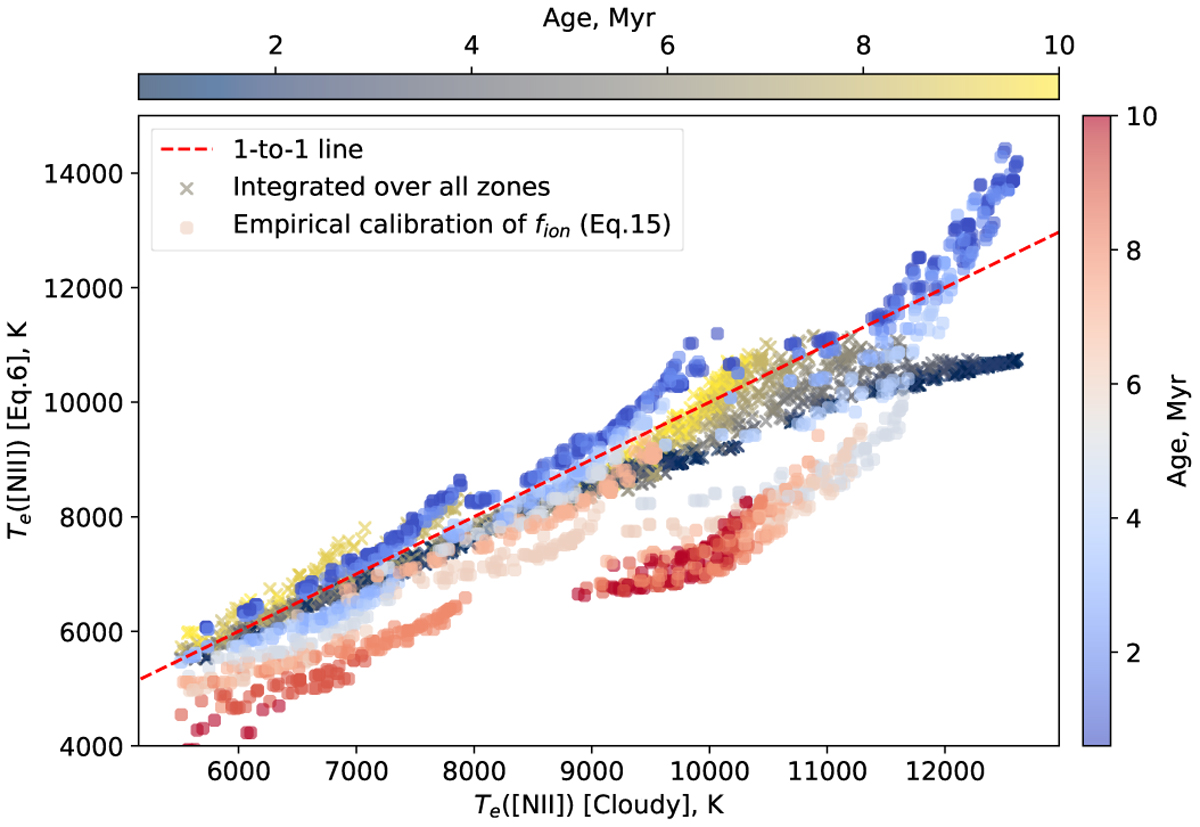
Validation of the resulting values for Te based on the Cloudy models. Crosses shows the values of Te([N ii]) obtained from the volumetric version of Eq. (6), which accounts for variations in fion and the spatial extent of the [O i] and Hα emitting zones (Eq. (A.23)). Circles represent the Te([N ii]) values yielded by Eq. (6) assuming the empirical calibration of fion (by Eq. (15)). The calculated values are compared with the“true” Te([N ii]) from the Cloudy models. The symbol color encodes the age of the ionizing cluster. Both data sets show generally good agreement with the one-to-one relation, but the empirical calibration significantly underestimate Te for old regions. We note that for the empirically calibrated results we show only the models with log([OI]/Hα) ≥ -3 and -1 ≥ log([SIII]/[SII]) ≤ −0.7 that correspond to the values obtained in our observations (see, e.g., Figs. 3 and 6). The prominent“tails” toward higher Te for the empirically calibrated values correspond only to those regions where log([SIII]/[SII]) > 0.5. Only a few such regions were used for calibration of Eq. (15), and thus the calibration is less certain for Η ii regions with the highest ionization parameters.
Current usage metrics show cumulative count of Article Views (full-text article views including HTML views, PDF and ePub downloads, according to the available data) and Abstracts Views on Vision4Press platform.
Data correspond to usage on the plateform after 2015. The current usage metrics is available 48-96 hours after online publication and is updated daily on week days.
Initial download of the metrics may take a while.