Fig. 16
Download original image
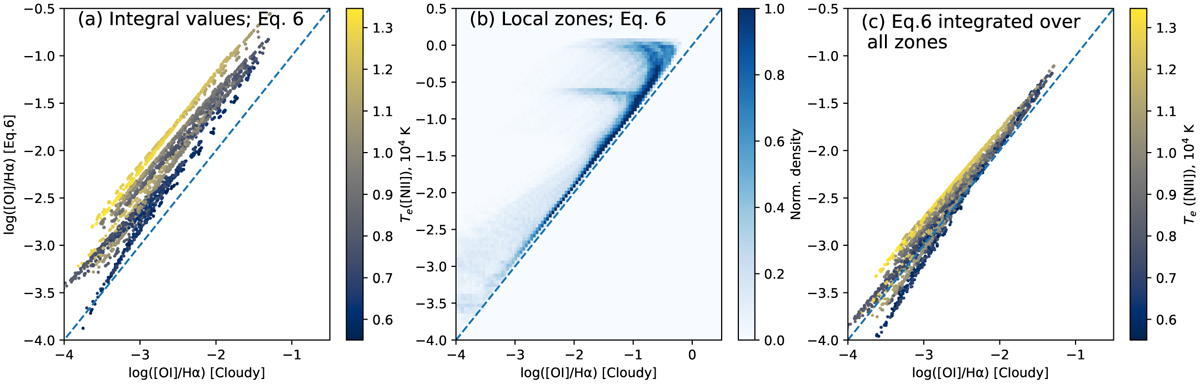
Validation of Eq. (6) using our Cloudy models. Panel α: comparison of [Ο i]/Ηα calculated with this relation assuming the mean fion (Eq. (16)) to the Cloudy output. Panel b: same comparison, but applied to the individual local zones in the Cloudy models. Here fion corresponds to the local values of n(H+)/n(H). Panel c: same test, but applied to results using Eq. (A.23) that are accounting for variations of fion and the spatial extent of the [O i] and Hα emitting zones.
Current usage metrics show cumulative count of Article Views (full-text article views including HTML views, PDF and ePub downloads, according to the available data) and Abstracts Views on Vision4Press platform.
Data correspond to usage on the plateform after 2015. The current usage metrics is available 48-96 hours after online publication and is updated daily on week days.
Initial download of the metrics may take a while.