Fig. 15
Download original image
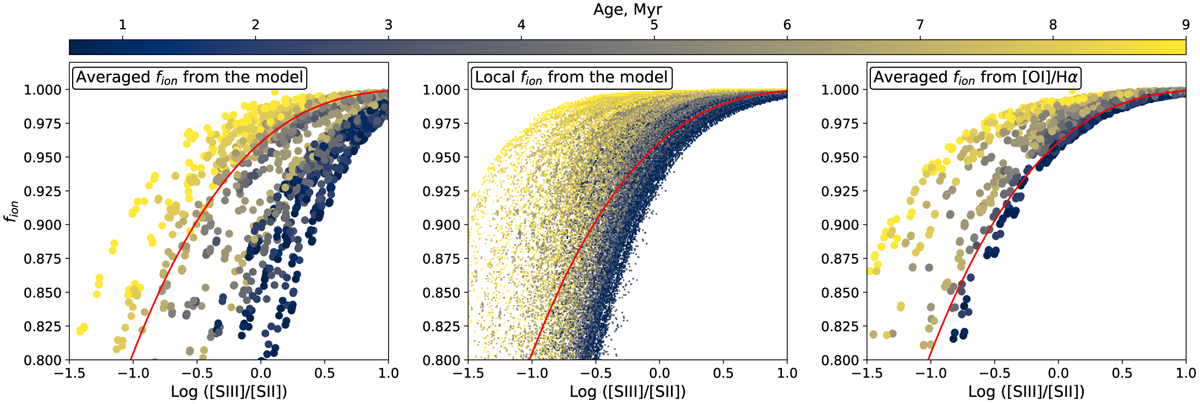
Relation between fion and [S iii]/[S ii] based on the Cloudy models. On the left-hand panel the value of fion is obtained directly from the model (as < n(H+) > / < n(H) >), while on the right-hand panel it was derived as in the observations (Eq. (6)) based on the integrated values of [Ο i]/Ηα metallicity and electron temperature Te([N ii]). Central panel: fion = n(H+)/n(H) in individual zones of the models. The colors on all panels correspond to the age of the ionizing cluster, and the red curve is the empirical relation derived from the observational data (Eq. (15)). Spatially integrating across the entire line emitting region clearly reduces the scatter in this relation, and brings the model results into better agreement with the empirical relation.
Current usage metrics show cumulative count of Article Views (full-text article views including HTML views, PDF and ePub downloads, according to the available data) and Abstracts Views on Vision4Press platform.
Data correspond to usage on the plateform after 2015. The current usage metrics is available 48-96 hours after online publication and is updated daily on week days.
Initial download of the metrics may take a while.