Fig. 13
Download original image
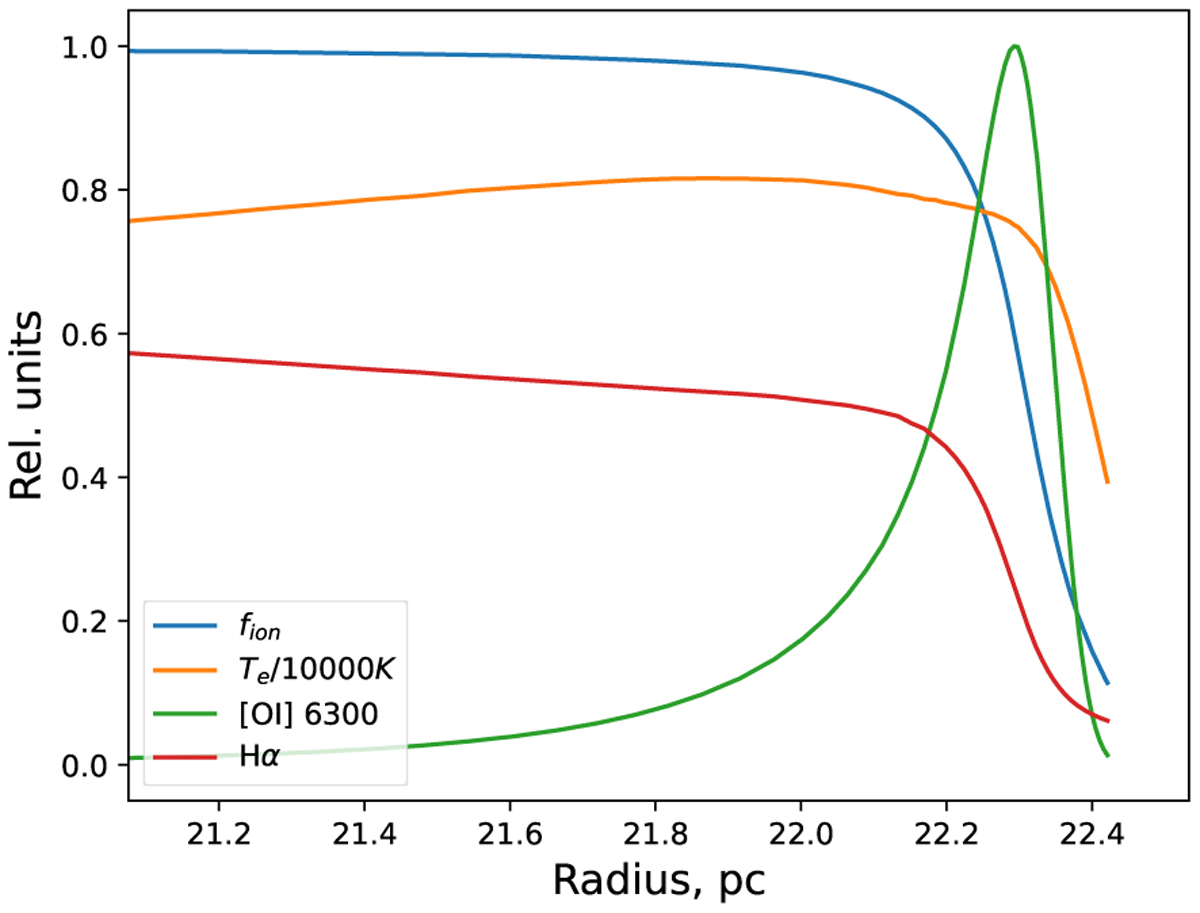
Cloudy modeling of the interior structure of a typical H ii region. The Hα emission (red) traces fairly closely the ionization fraction (fion, blue) as a function of radius, while the [O i] (green) is predominantly emitted in the outer shell of the nebula. In this way, it is apparent that very little of the Hα emission is co-spatial with the [O i], a key assumption in our model. At the outer edge of the nebula, the intensity of [O i] rapidly drops together with the electron temperature Te (orange).
Current usage metrics show cumulative count of Article Views (full-text article views including HTML views, PDF and ePub downloads, according to the available data) and Abstracts Views on Vision4Press platform.
Data correspond to usage on the plateform after 2015. The current usage metrics is available 48-96 hours after online publication and is updated daily on week days.
Initial download of the metrics may take a while.