Fig. 11
Download original image
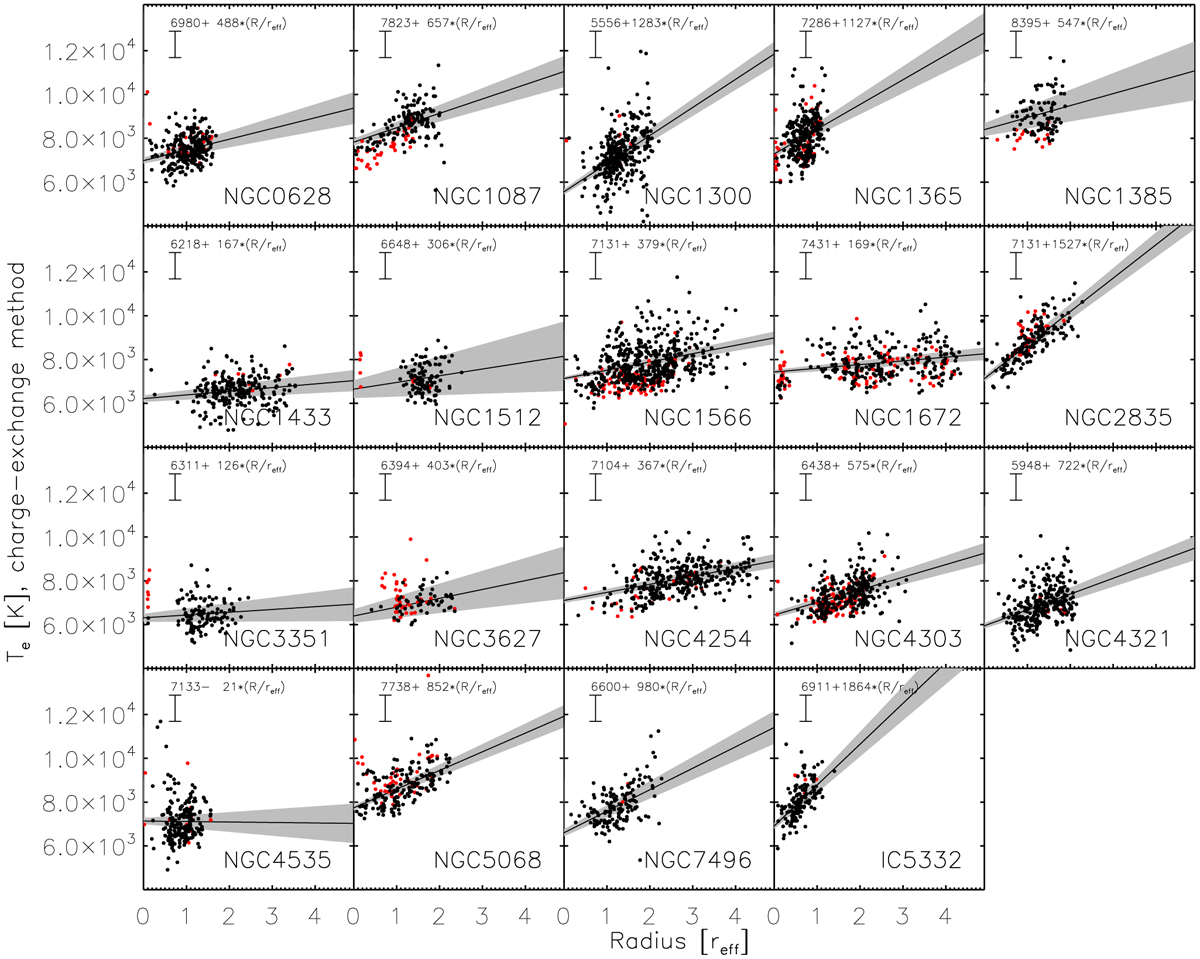
Radial gradient in Te for each of the PHANGS-MUSE galaxies. Red points show Te determined from auroral line measurements, while black points show Te measured using the charge-exchange method. Positive slopes show general agreement with the expected flat to negative metallicity gradients reported in these and other nearby galaxies (Pilyugin et al. 2014; Kreckel et al. 2019). A linear fit is shown for each galaxy, with the fit parameters listed in the top of each plot. The gray band indicates the uncertainty in the linear fit, accounting for 600 Κ systematic uncertainty in the Te measurements.
Current usage metrics show cumulative count of Article Views (full-text article views including HTML views, PDF and ePub downloads, according to the available data) and Abstracts Views on Vision4Press platform.
Data correspond to usage on the plateform after 2015. The current usage metrics is available 48-96 hours after online publication and is updated daily on week days.
Initial download of the metrics may take a while.