Fig. 10
Download original image
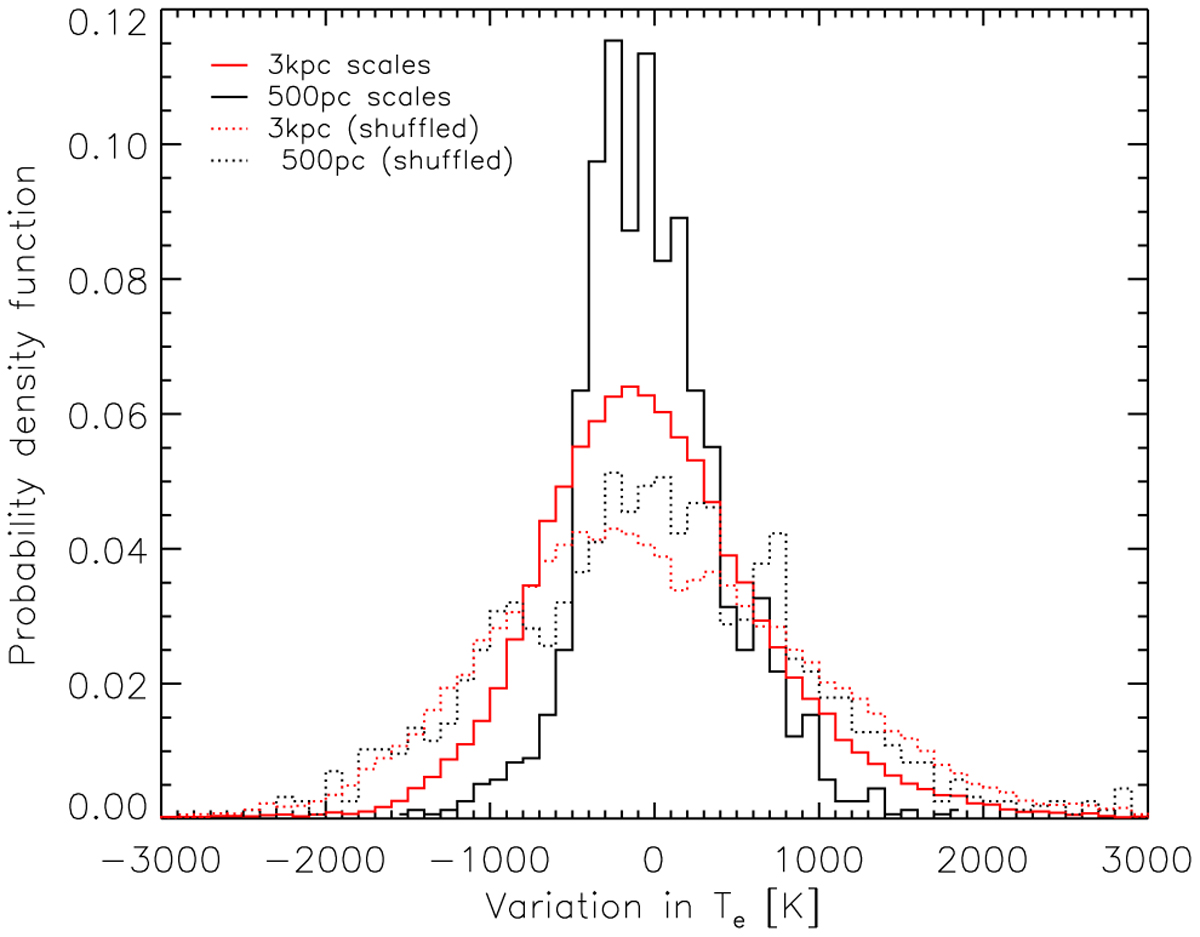
Probability density function of the variations in Te at 500 pc (black) and 3 kpc (red), sampling scales across all galaxies in the sample. We performed this calculation around each H ii region, relative to the mean local value at each position. We required at least five H ii regions be located within the relevant sampling scale length to minimize biases due to low number statistics. Across all galaxies, we measure a standard deviation of ~500 K at 500 pc scales and ~800 K at 3 kpc scales. To test the null hypothesis, that all region temperatures are uncorrelated, we shuffled all values of Te and repeated this calculation (dotted lines).
Current usage metrics show cumulative count of Article Views (full-text article views including HTML views, PDF and ePub downloads, according to the available data) and Abstracts Views on Vision4Press platform.
Data correspond to usage on the plateform after 2015. The current usage metrics is available 48-96 hours after online publication and is updated daily on week days.
Initial download of the metrics may take a while.