Fig. 1
Download original image
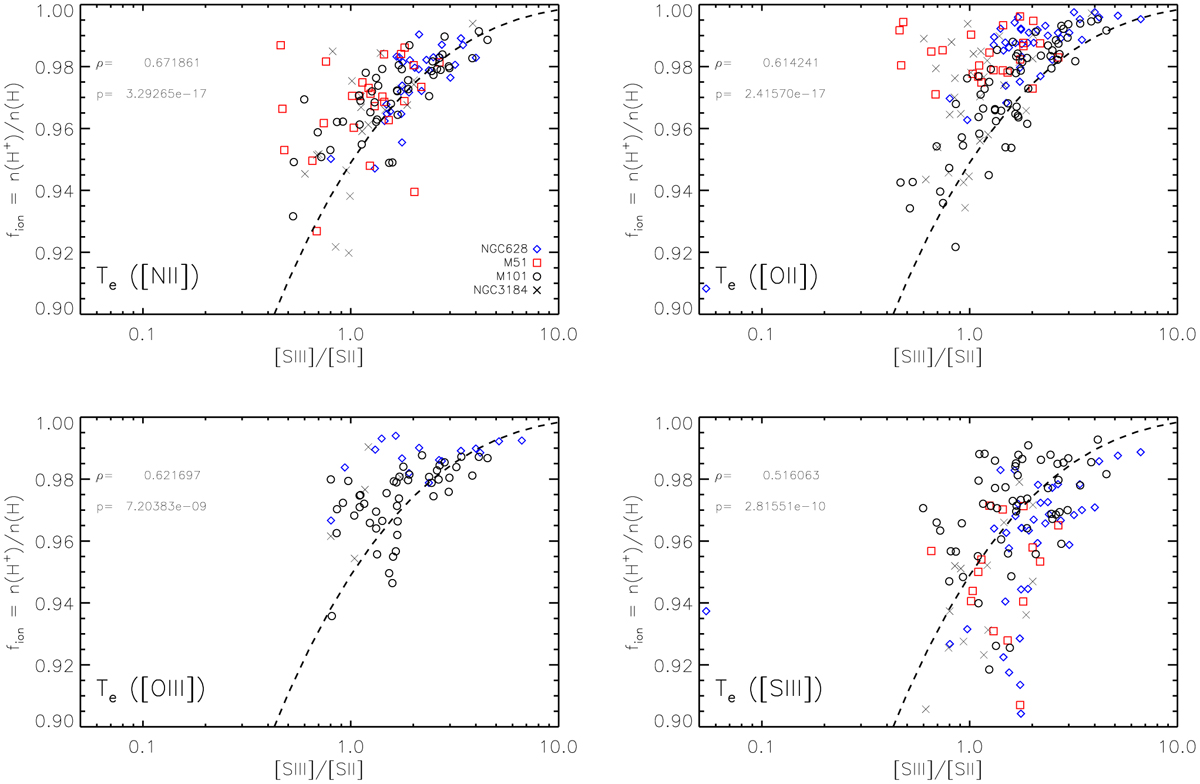
For the CHAOS H ii regions: fion modeled based on Eq. (6), assuming different input electron temperatures based on auroral line measurements (Te([N ii]), Te([O ii]), Te([O iii]), and Te([S iii])) as well as their reported 12+log(O/H) and [Ο i]/Ηα. Each of the four galaxies is shown with separate symbols, and the Spearman's rank correlation coefficient (ρ) and its significance (p) are shown in each figure. Each value of fion is plotted as a function of the [S iii]/[S ii] line ratio, which robustly traces changes in the ionization parameter (Kewley & Dopita 2002). We identify Te([N ii]) as showing the strongest correlation (ρ = 0.69) and a large number of detections and therefore chose to adopt Te([N ii]) as a reference temperature for the rest of the analysis in this paper. The dashed line shows the fit derived in Sect. 4.2, using a combination of PHANGS-MUSE and CHAOS Η ii regions. This same line is overplotted for the other panels (dashed lines) to allow comparison across the ionic temperatures.
Current usage metrics show cumulative count of Article Views (full-text article views including HTML views, PDF and ePub downloads, according to the available data) and Abstracts Views on Vision4Press platform.
Data correspond to usage on the plateform after 2015. The current usage metrics is available 48-96 hours after online publication and is updated daily on week days.
Initial download of the metrics may take a while.