Open Access
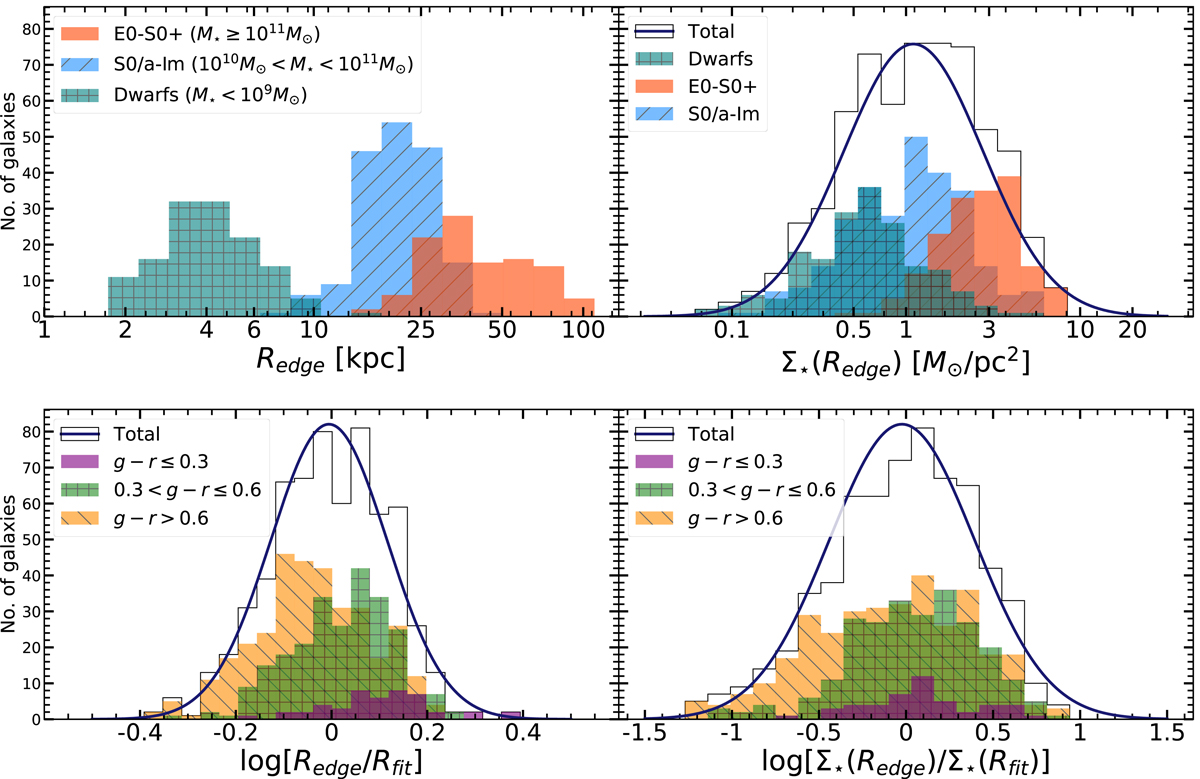
Fig. 7.
Download original image
Representation of the results shown in Fig. 5 as histograms. Top: the distribution of Redge (left) and Σ⋆(Redge). Bottom: the distribution of (g − r)edge in the Redge–stellar mass (left) and Σ⋆(Redge)–stellar mass (right) relations. The subscript ‘fit’ refers to the best fit line of each plane.
Current usage metrics show cumulative count of Article Views (full-text article views including HTML views, PDF and ePub downloads, according to the available data) and Abstracts Views on Vision4Press platform.
Data correspond to usage on the plateform after 2015. The current usage metrics is available 48-96 hours after online publication and is updated daily on week days.
Initial download of the metrics may take a while.