Fig. 5.
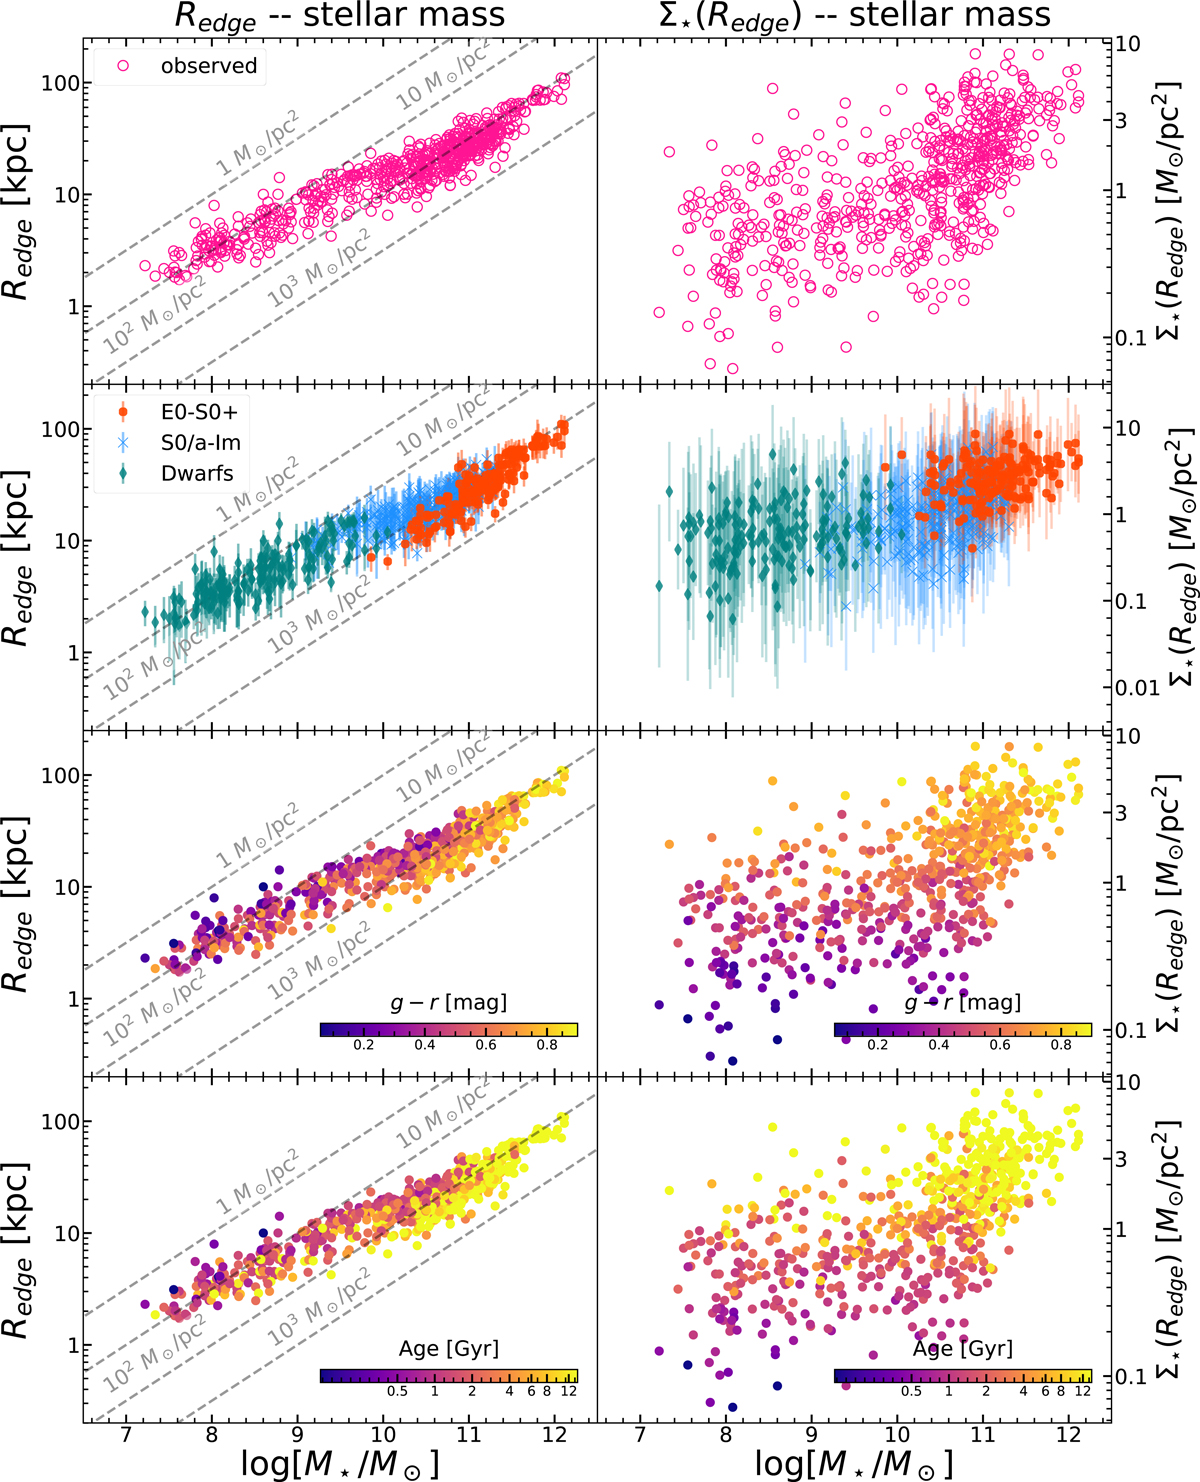
Download original image
Redge–stellar mass (left) and Σ⋆(Redge)–stellar mass (right) relations derived in this work. Only those galaxies where an edge was identified are plotted (624 objects). The grey lines in the Redge–stellar mass planes are lines of constant stellar mass surface density within the Redge of the object. Top to bottom: each row shows the same observed relations (top), colour coded according to the morphology of the galaxies, (g − r)edge and a proxy for the age at Redge, for a fixed metallicity [M/H]= − 0.71. We plot the uncertainties in our measurements (see Sect. 4) only in the second row for clarity in the other panels.
Current usage metrics show cumulative count of Article Views (full-text article views including HTML views, PDF and ePub downloads, according to the available data) and Abstracts Views on Vision4Press platform.
Data correspond to usage on the plateform after 2015. The current usage metrics is available 48-96 hours after online publication and is updated daily on week days.
Initial download of the metrics may take a while.