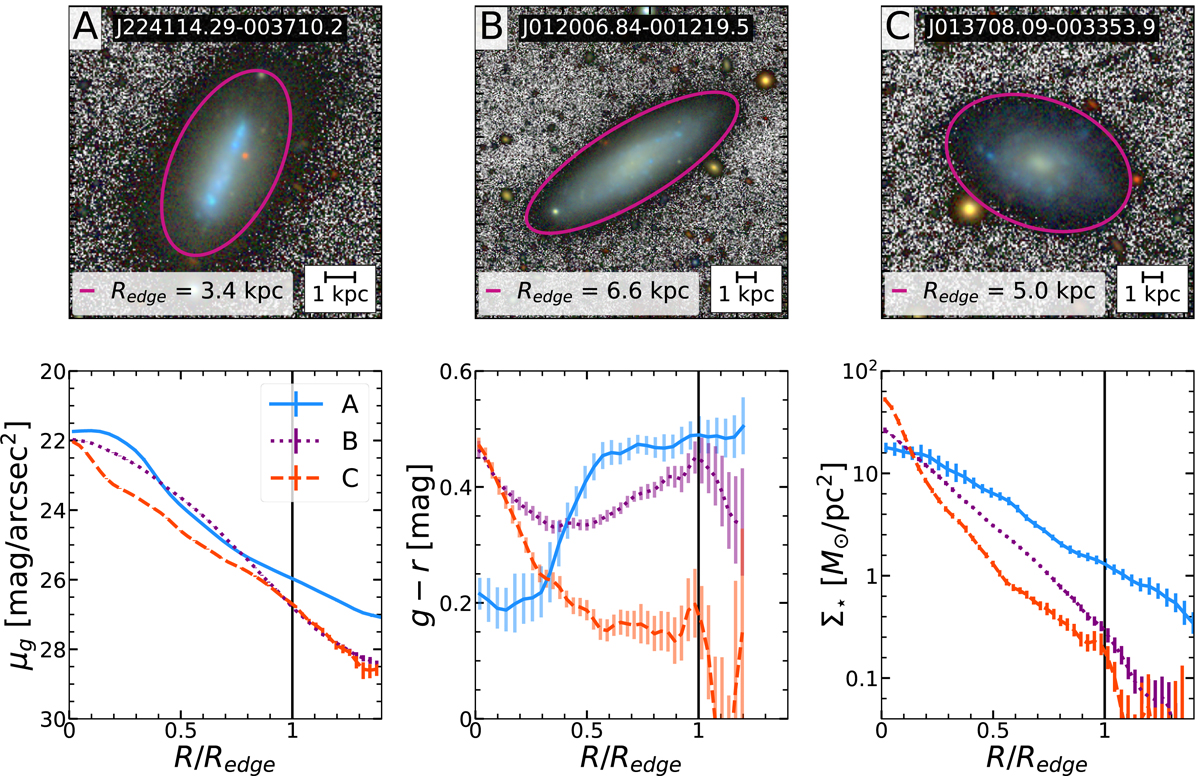
Fig. 4.
Download original image
Similar to Fig. 3, but for three dwarf galaxies with stellar mass ∼108 M⋆. These examples were specifically chosen to illustrate the diversity in the colour profiles of this galaxy population and the criteria we use to we locate the edge in these different cases. In case A, we use the change in slope in the Σ⋆ profile. In B and C, the edge is identified as a sudden transition to bluer colours in the g − r profile (see Sect. 5.4 for details). The edges of these galaxies occur at mass densities Σ⋆(Redge)≲2 M⊙ pc−2.
Current usage metrics show cumulative count of Article Views (full-text article views including HTML views, PDF and ePub downloads, according to the available data) and Abstracts Views on Vision4Press platform.
Data correspond to usage on the plateform after 2015. The current usage metrics is available 48-96 hours after online publication and is updated daily on week days.
Initial download of the metrics may take a while.