Open Access
Fig. D.2.
Download original image
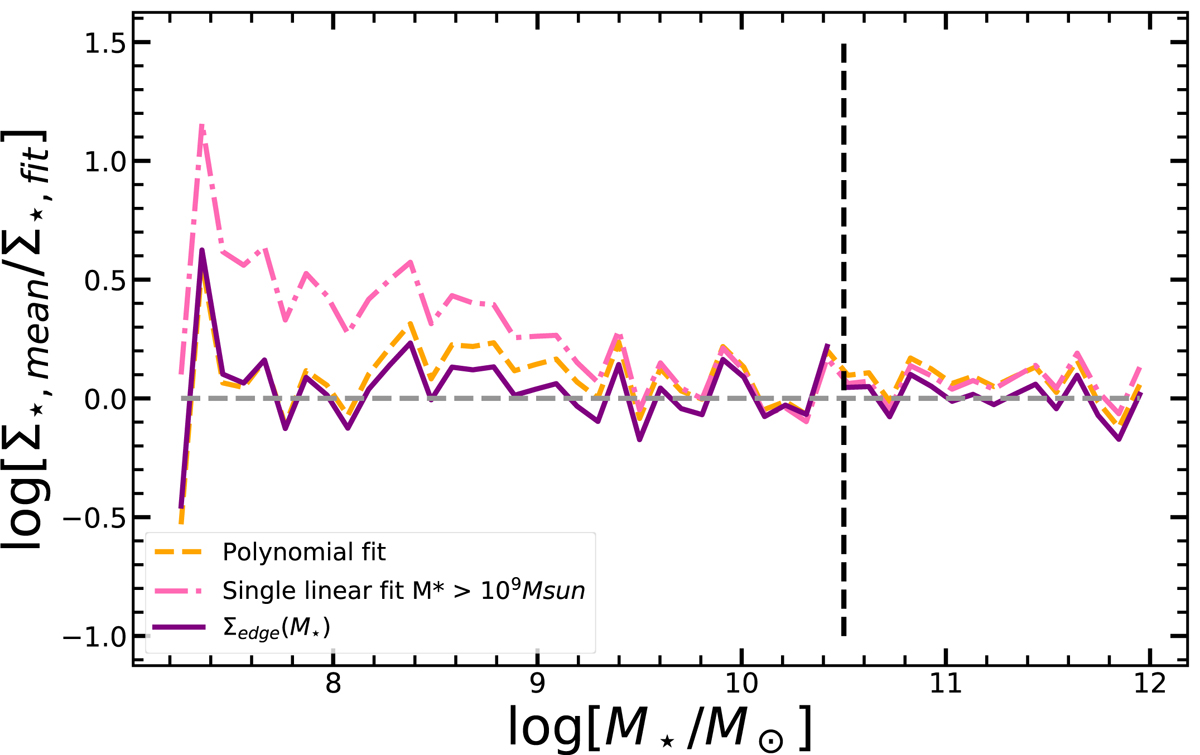
Comparing the residuals of the fits to the mean Σ⋆(Redge) relation. The single linear fit in pink used here is computed for galaxies with M⋆ > 109 M⊙. The reduced chi-square values are 1.6 and 1.7 for the purple Σedge(M⋆) relations in Eqs. 3 and 4, 3.1 for the pink linear relation and 2.9 for the polynomial fit.
Current usage metrics show cumulative count of Article Views (full-text article views including HTML views, PDF and ePub downloads, according to the available data) and Abstracts Views on Vision4Press platform.
Data correspond to usage on the plateform after 2015. The current usage metrics is available 48-96 hours after online publication and is updated daily on week days.
Initial download of the metrics may take a while.