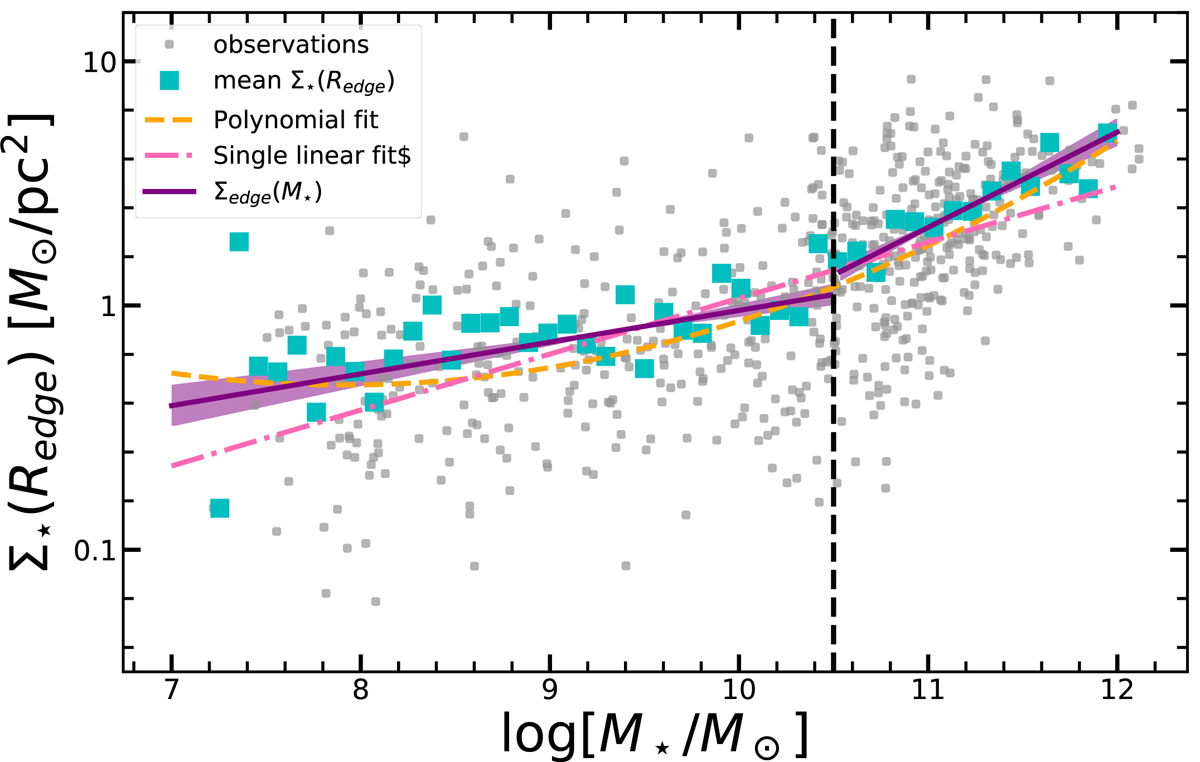
Fig. D.1.
Download original image
Fitting functions for the Σ⋆(Redge)−M⋆ relation (grey points). The mean Σ⋆(Redge) is computed in steps of 0.1 dex over the plotted stellar mass range (cyan squares). The best fits (purple lines) are the two linear relations in Eqs. 3 and 4, split at 1010.5 M⊙ (vertical black dashed line). For contrast, we also show a single linear fit (pink dot-dashed line) and polynomial fit of degree two for the full sample (orange dashed line).
Current usage metrics show cumulative count of Article Views (full-text article views including HTML views, PDF and ePub downloads, according to the available data) and Abstracts Views on Vision4Press platform.
Data correspond to usage on the plateform after 2015. The current usage metrics is available 48-96 hours after online publication and is updated daily on week days.
Initial download of the metrics may take a while.