Fig. 8.
Download original image
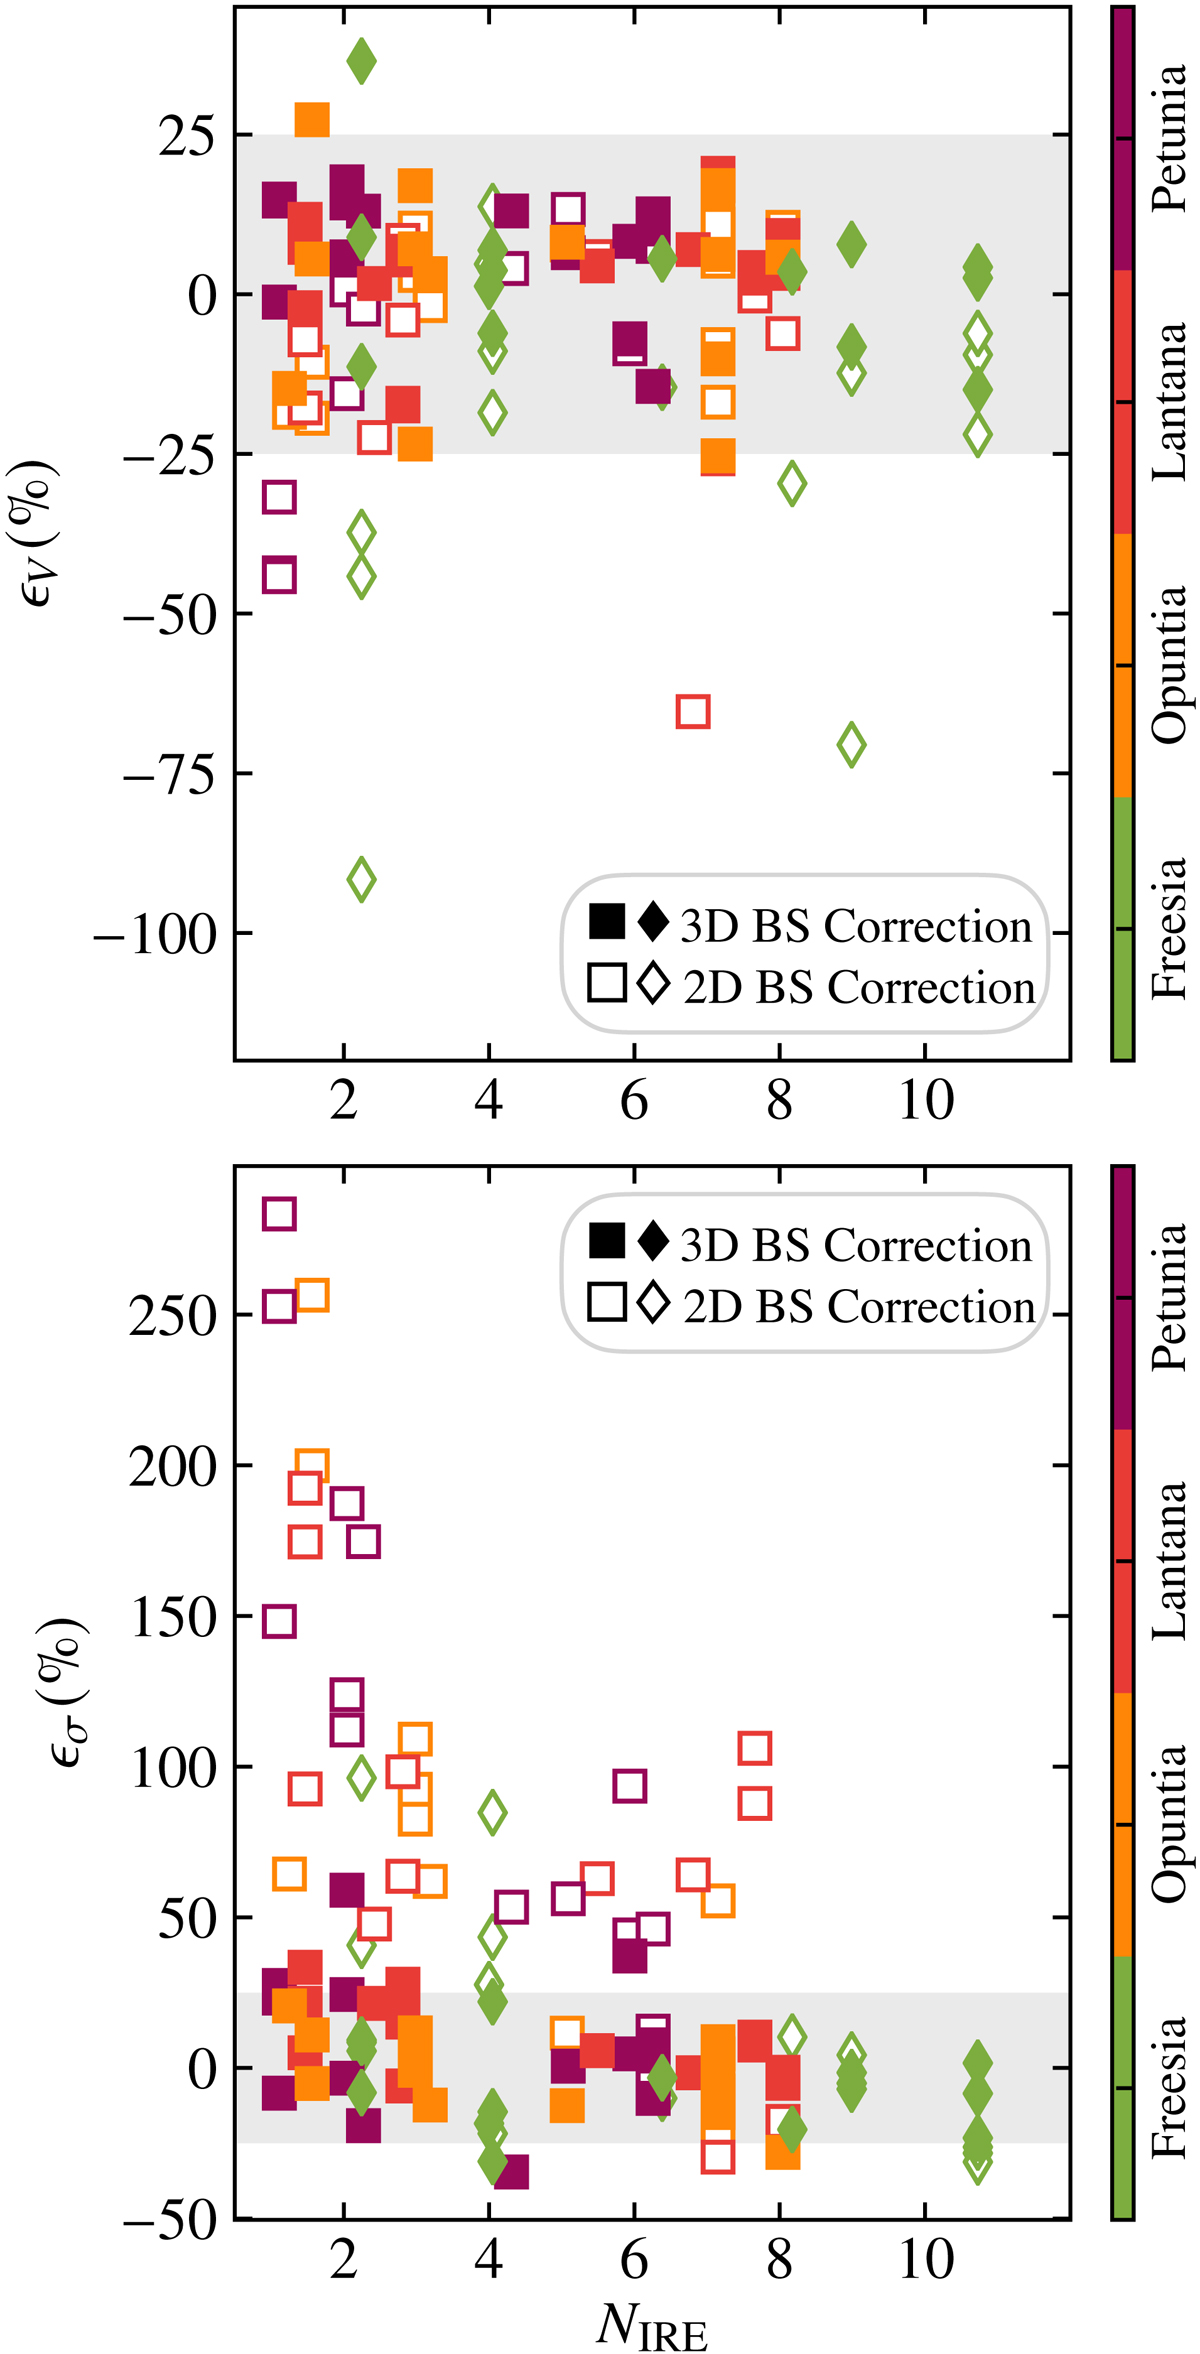
Relative errors of the recovered rotation velocities (upper panel) and velocity dispersions (bottom panel), computed using Eqs. (2) and (3) for the disturbed disks Freesia (diamonds) and the three disks (squares) of our sample as a function of resolution (number of independent resolution elements along the semi-major axis). Markers with the same color show the mock data for the same galaxy as indicated by the color-bar. The filled and empty markers show the errors for the rotation velocities and velocity dispersions obtained with 3DBAROLO (forward-modeling) and with the velocity-gradient beam-smearing correction. The gray areas mark the 25 percentage.
Current usage metrics show cumulative count of Article Views (full-text article views including HTML views, PDF and ePub downloads, according to the available data) and Abstracts Views on Vision4Press platform.
Data correspond to usage on the plateform after 2015. The current usage metrics is available 48-96 hours after online publication and is updated daily on week days.
Initial download of the metrics may take a while.