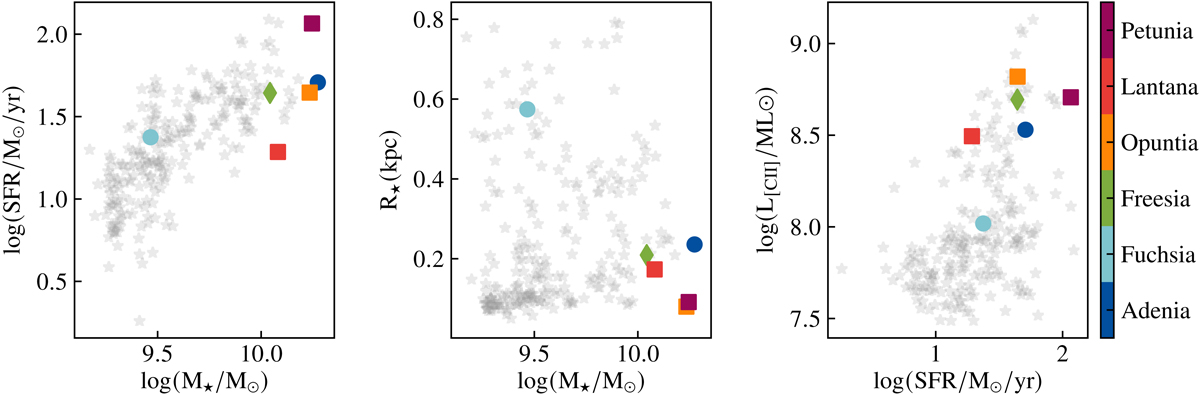
Fig. 1.
Download original image
Physical properties of the parent and selected sample. The gray stars show the position of EoR galaxies from the SERRA suite (see Pallottini et al. 2022; Kohandel et al., in prep.) in the SFR-M⋆ (left panel), size-M⋆ (medium panel), L[CII]-SFR (right panel) planes. The squares and circles show the selected disks and mergers, respectively, color-coded with the names as indicated by the color-bar. The green diamond shows the disturbed disk Freesia.
Current usage metrics show cumulative count of Article Views (full-text article views including HTML views, PDF and ePub downloads, according to the available data) and Abstracts Views on Vision4Press platform.
Data correspond to usage on the plateform after 2015. The current usage metrics is available 48-96 hours after online publication and is updated daily on week days.
Initial download of the metrics may take a while.