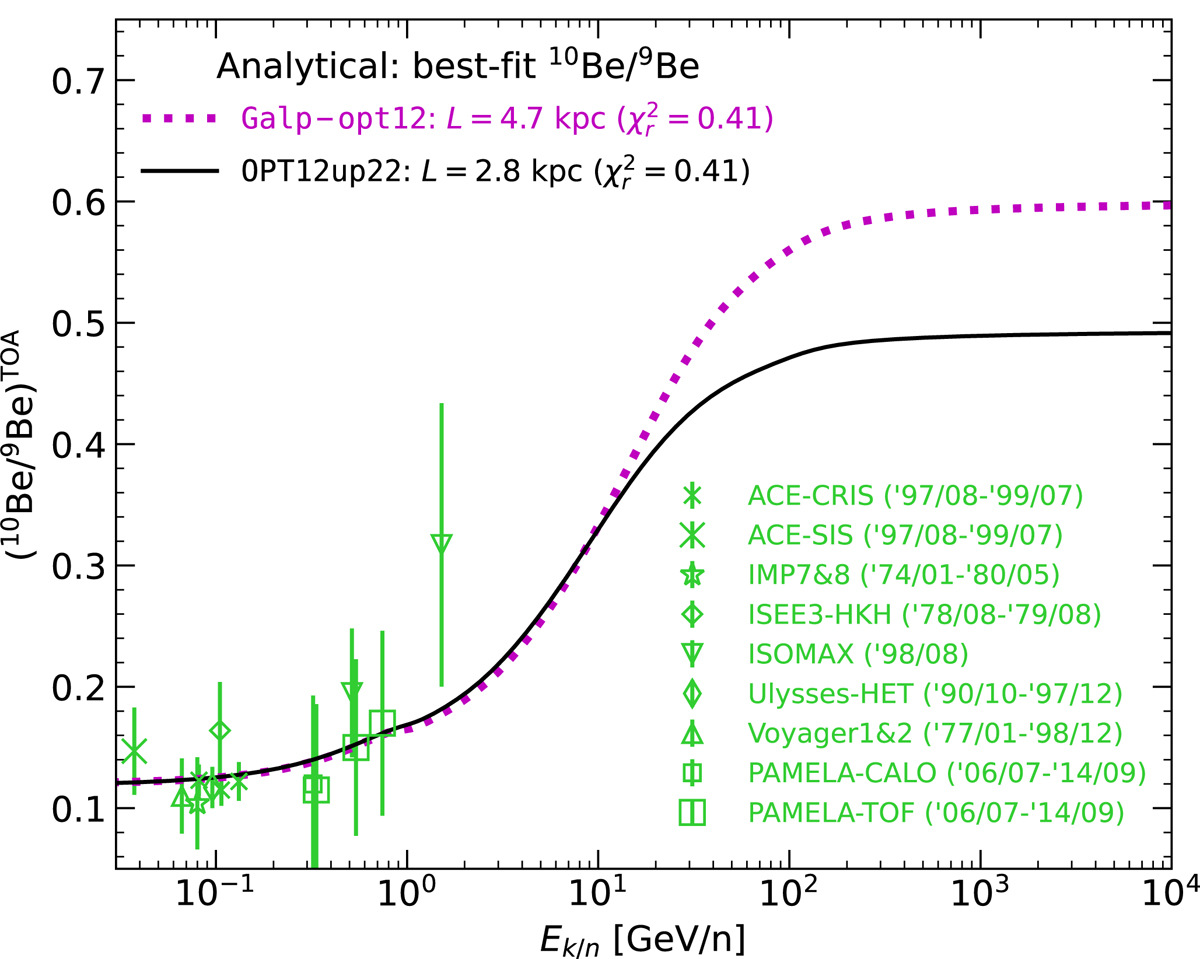
Fig. 5.
Download original image
Best-fit model on 10Be/9Be data using the analytical model, for ℱ and tdiff input values estimated from different publications: Galp-opt12 (dotted magenta line) and OPT12up22 (solid black line) are taken from Maurin et al. (2022). The models are shown for ϕ = 700 MV, typically corresponding to the average modulation of all the data (green symbols), whose references are given in the text.
Current usage metrics show cumulative count of Article Views (full-text article views including HTML views, PDF and ePub downloads, according to the available data) and Abstracts Views on Vision4Press platform.
Data correspond to usage on the plateform after 2015. The current usage metrics is available 48-96 hours after online publication and is updated daily on week days.
Initial download of the metrics may take a while.