Fig. 4.
Download original image
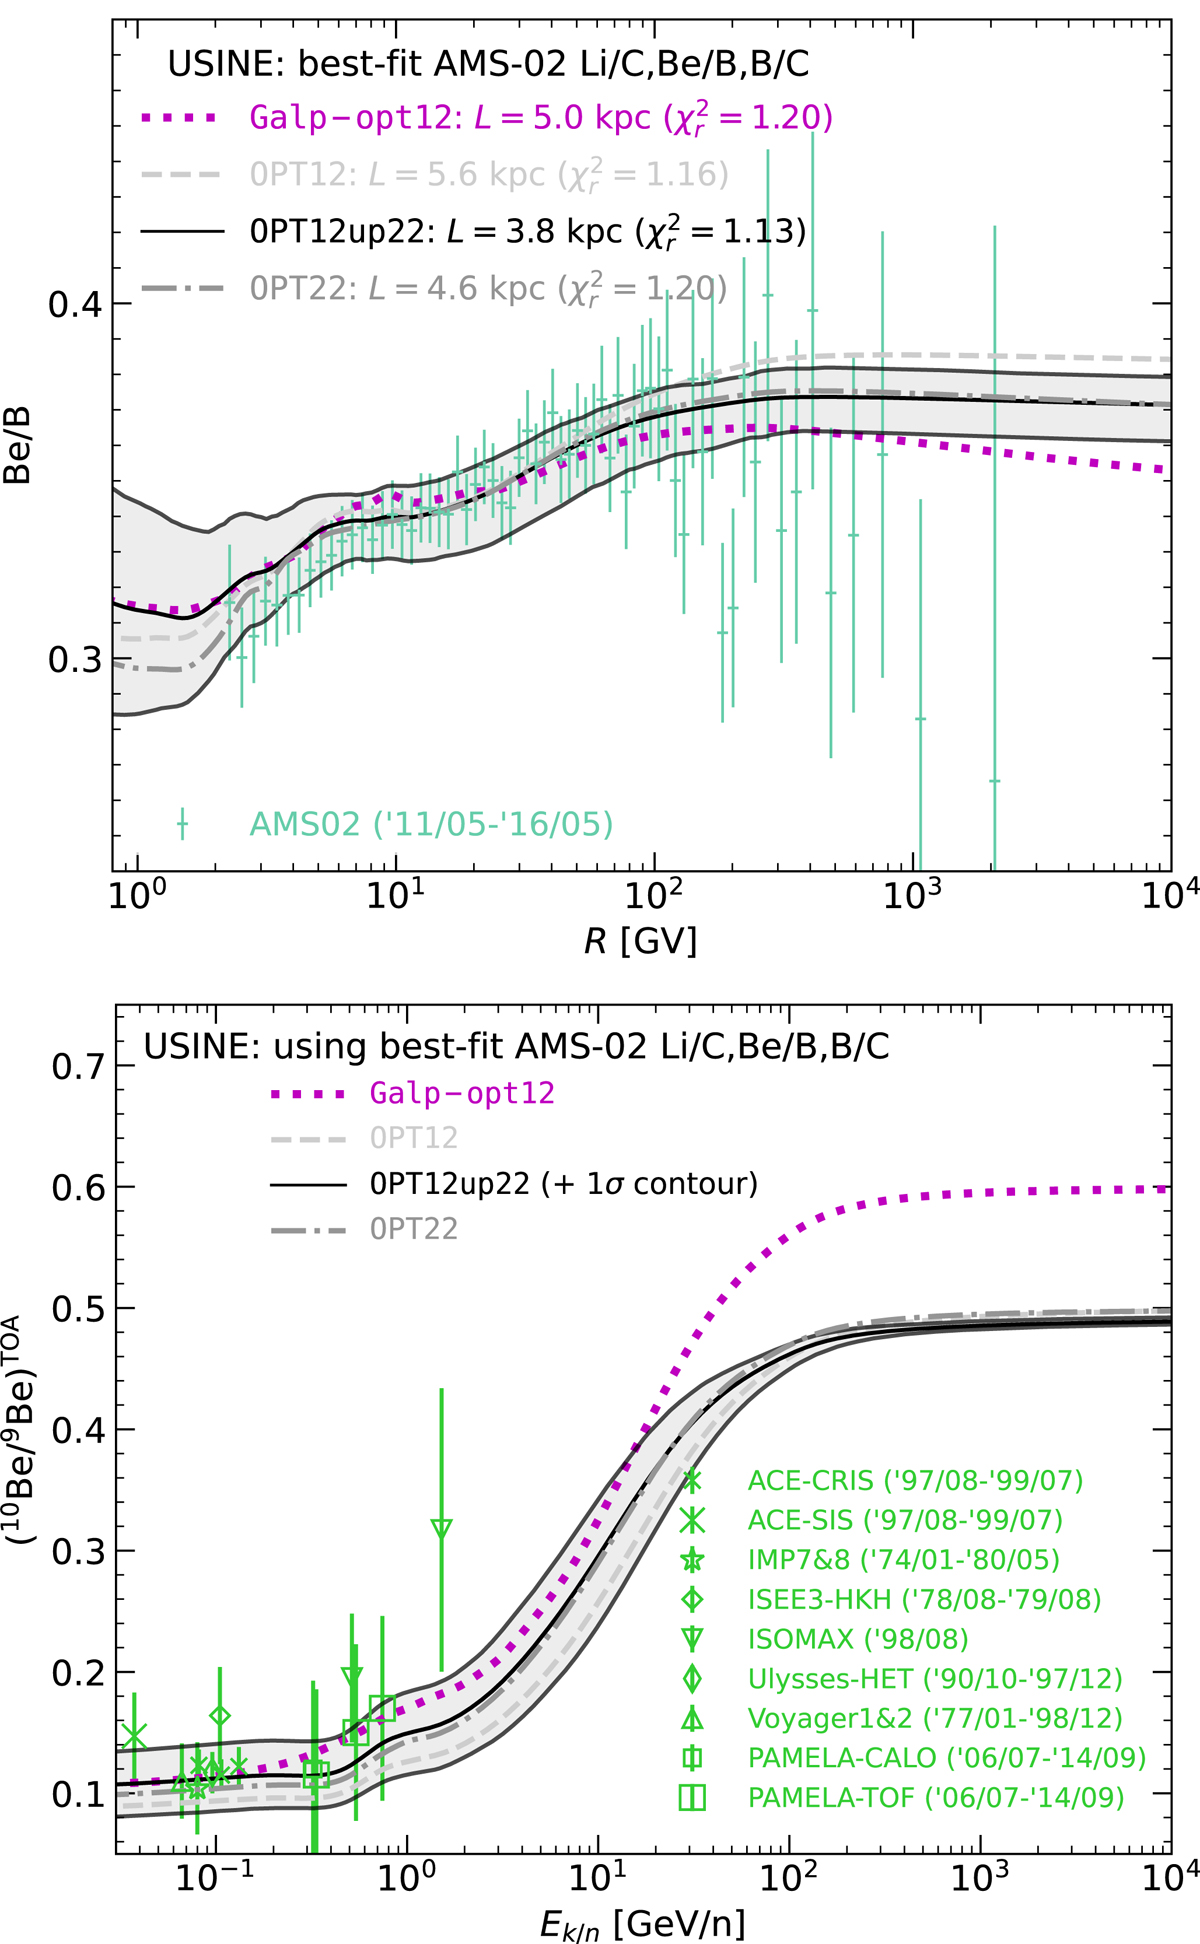
Best-fit models from the combined analysis of AMS-02 Li/C, Be/B, and B/C data with USINE (see Table 1). The four line styles correspond to the four production cross-section sets discussed in Sect. 3.1 (Galp-opt12, OPT12, OPT12up22, and OPT22). We also show 1σ CLs, but for the OPT12up22 set only (solid black lines), the other sets giving similar contours. Top panel: Be/B as a function of rigidity, along with the AMS-02 data (Aguilar et al. 2018) used for the fit. Bottom panel: 10Be/9Be as a function of kinetic energy per nucleon for the same transport parameters and L as above (i.e., from best-fit to Li/C, Be/B, and B/C data only, no fit to 10Be/9Be). A compilation of data (green symbols) is shown for illustrative purpose.
Current usage metrics show cumulative count of Article Views (full-text article views including HTML views, PDF and ePub downloads, according to the available data) and Abstracts Views on Vision4Press platform.
Data correspond to usage on the plateform after 2015. The current usage metrics is available 48-96 hours after online publication and is updated daily on week days.
Initial download of the metrics may take a while.