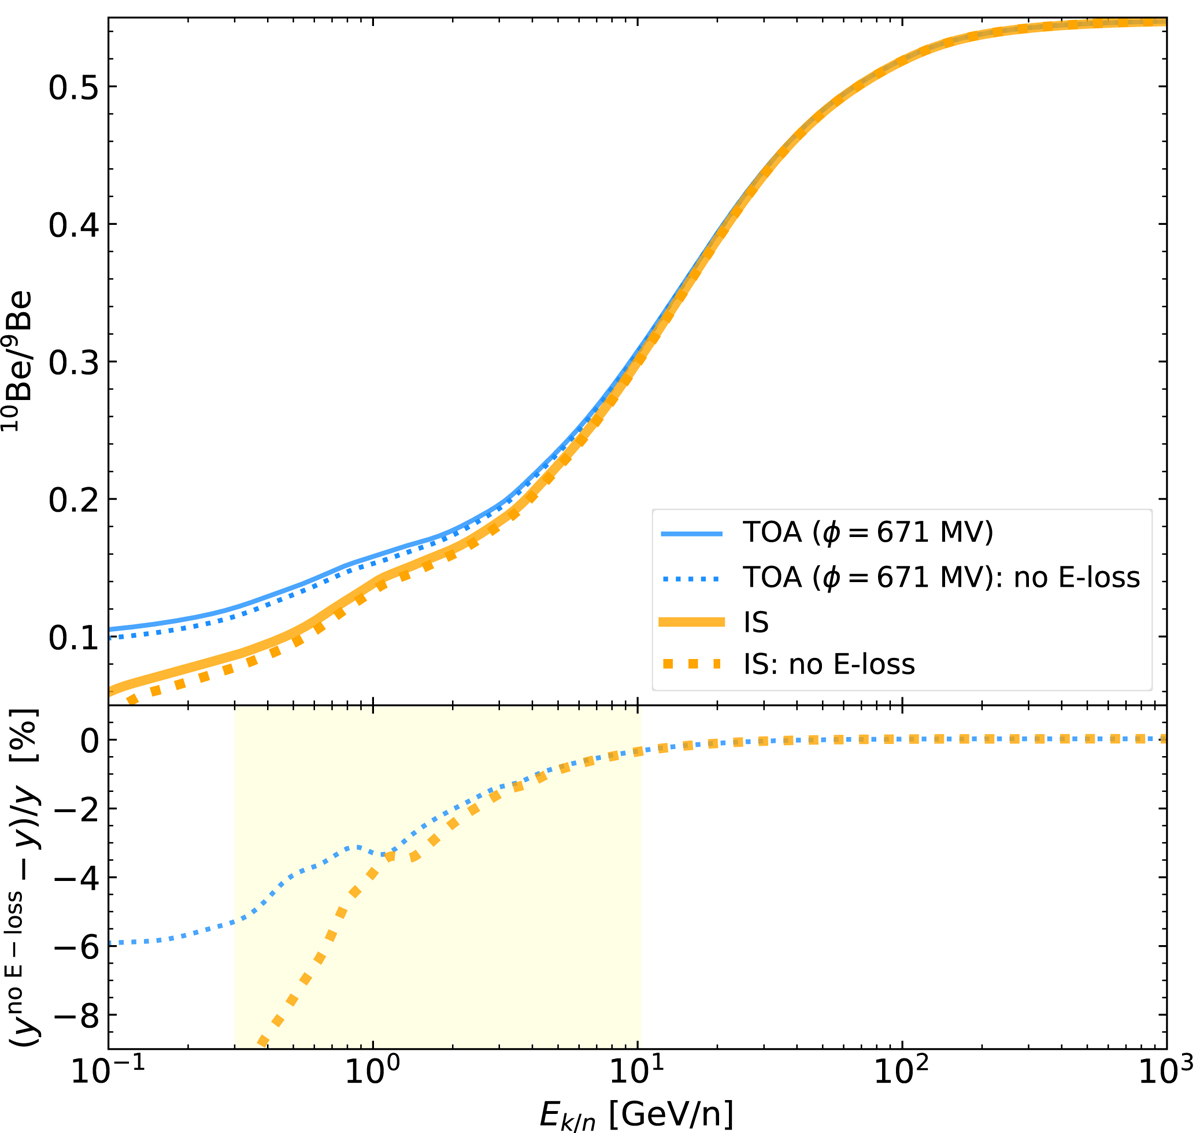
Fig. 1.
Download original image
Impact of neglecting energy losses in the 10Be/9Be ratio as a function of the kinetic energy per nucleon (all curves are from USINE runs). Top panel: calculation with energy losses switched on (solid lines) or off (dotted lines) for TOA (blue) or IS (orange) calculations. Bottom panel: relative difference between the ‘no E loss’ and ‘with E losses’ calculations, for the TOA (dotted blue line) and IS (dashed orange line) cases. The range highlighted in yellow corresponds to the region where the AMS-02 and HELIX experiments should measure 10Be/9Be.
Current usage metrics show cumulative count of Article Views (full-text article views including HTML views, PDF and ePub downloads, according to the available data) and Abstracts Views on Vision4Press platform.
Data correspond to usage on the plateform after 2015. The current usage metrics is available 48-96 hours after online publication and is updated daily on week days.
Initial download of the metrics may take a while.