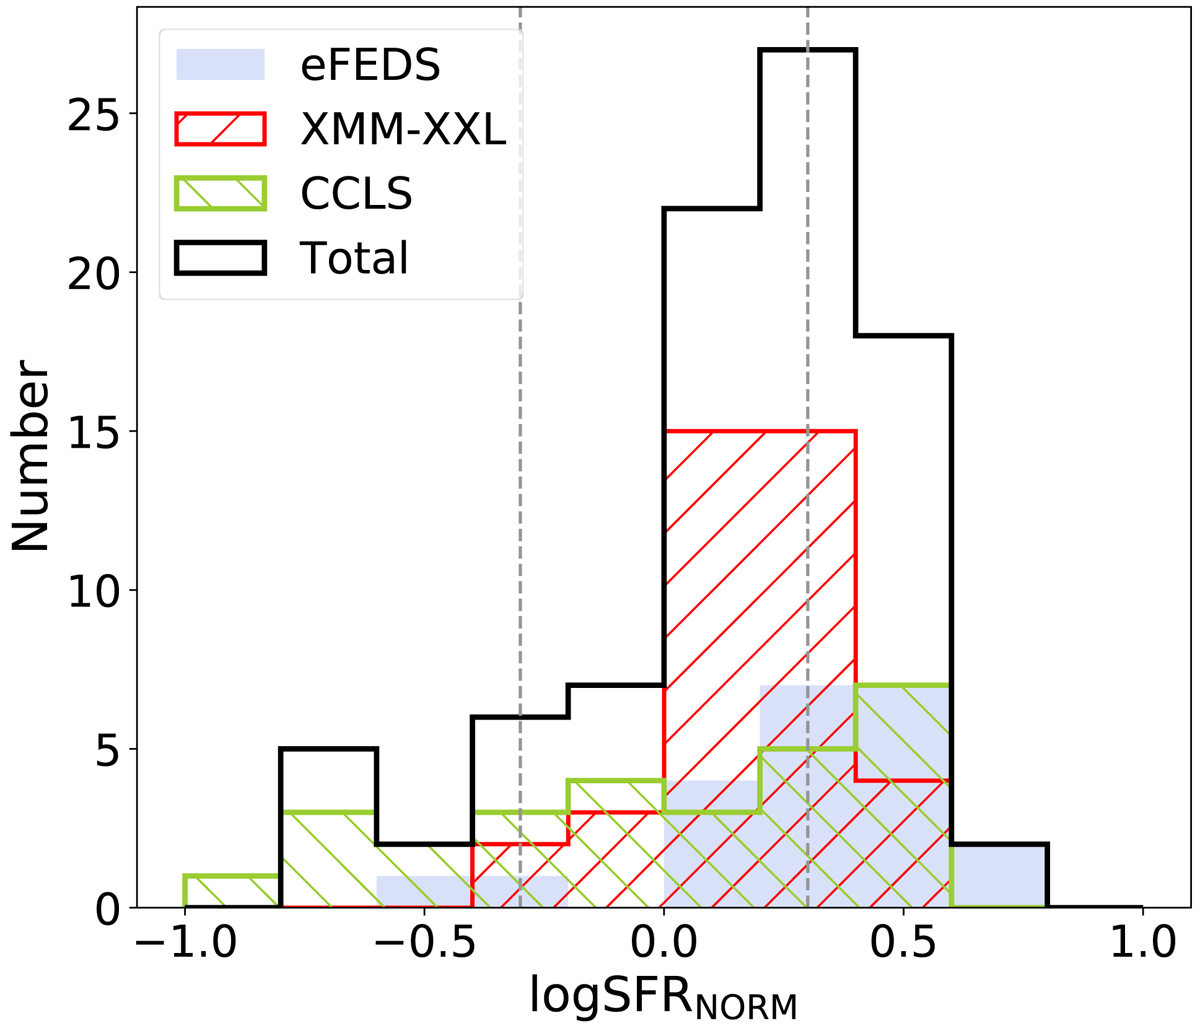
Fig. 8.
Download original image
Distributions of SFRNORM for our three samples (as indicated in the legend) and also for the total population (black histogram). The mean and median values of the latter are log(SFRNORM) = 0.17 and log(SFRNORM) = 0.20, respectively. The units are given in logarithmic scale. The vertical dashed lines indicate the limits considered in our analysis for the main sequence of star-forming galaxies (±0.3 dex).
Current usage metrics show cumulative count of Article Views (full-text article views including HTML views, PDF and ePub downloads, according to the available data) and Abstracts Views on Vision4Press platform.
Data correspond to usage on the plateform after 2015. The current usage metrics is available 48-96 hours after online publication and is updated daily on week days.
Initial download of the metrics may take a while.