Fig. 5.
Download original image
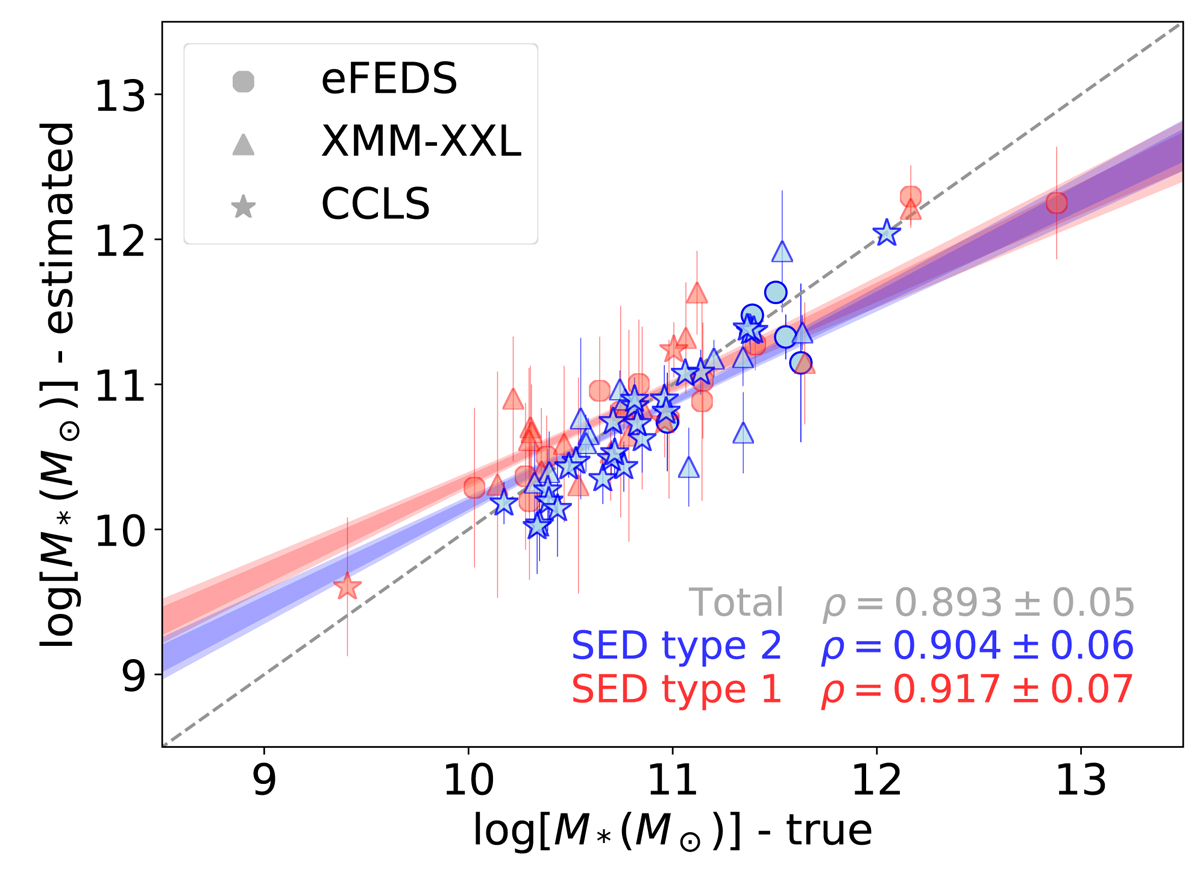
Estimated M* based on the mock catalogue compared to the true values provided by the best-fit model for type 1 (red) and type 2 (blue) AGNs. The dashed line represent the 1-to-1 relation. The Pearson correlation factors for the two samples are ρtype1 = 0.917 and ρtype2 = 0.904, respectively. The shaded regions correspond to 1σ and 2σ confidence bands of the linear regression obtained with BCES for the two samples.
Current usage metrics show cumulative count of Article Views (full-text article views including HTML views, PDF and ePub downloads, according to the available data) and Abstracts Views on Vision4Press platform.
Data correspond to usage on the plateform after 2015. The current usage metrics is available 48-96 hours after online publication and is updated daily on week days.
Initial download of the metrics may take a while.