Fig. 4.
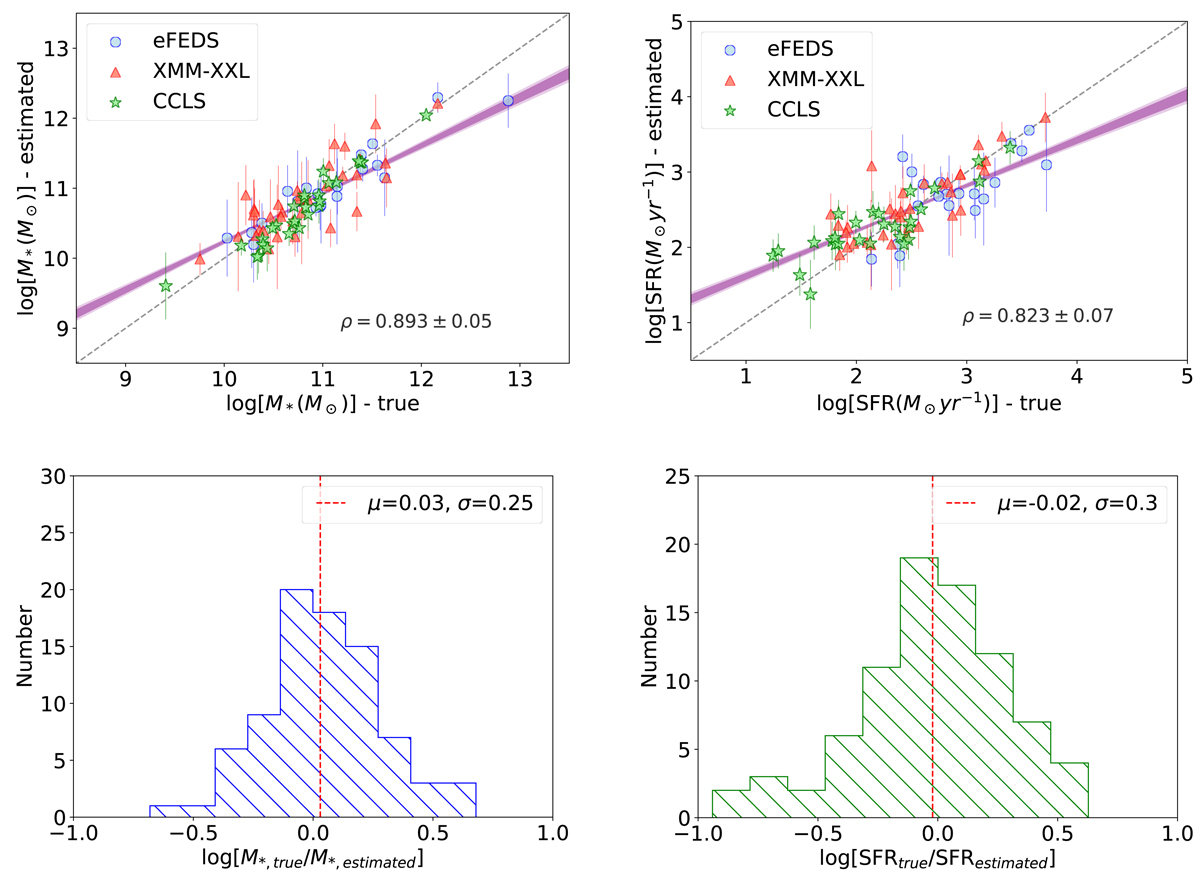
Download original image
Reliability of the host galaxy properties estimations using the X-CIGALE mock catalogues. Upper panels: estimated parameters, M* (left) and SFR (right) based on the mock catalogues compared to the true values provided by the best-fit model for the three fields used in our analysis as indicated. The dashed line represent the 1-to-1 relation to assist the plot interpretation, while in each plot we give the linear Pearson correlation coefficient (ρ) of the combined sample. The shaded regions correspond to 1σ and 2σ confidence bands of the linear regression obtained with BCES. Lower panels: corresponding distributions of the difference between estimated and true values. We provide the mean and standard deviation in each case as well.
Current usage metrics show cumulative count of Article Views (full-text article views including HTML views, PDF and ePub downloads, according to the available data) and Abstracts Views on Vision4Press platform.
Data correspond to usage on the plateform after 2015. The current usage metrics is available 48-96 hours after online publication and is updated daily on week days.
Initial download of the metrics may take a while.