Fig. B.4.
Download original image
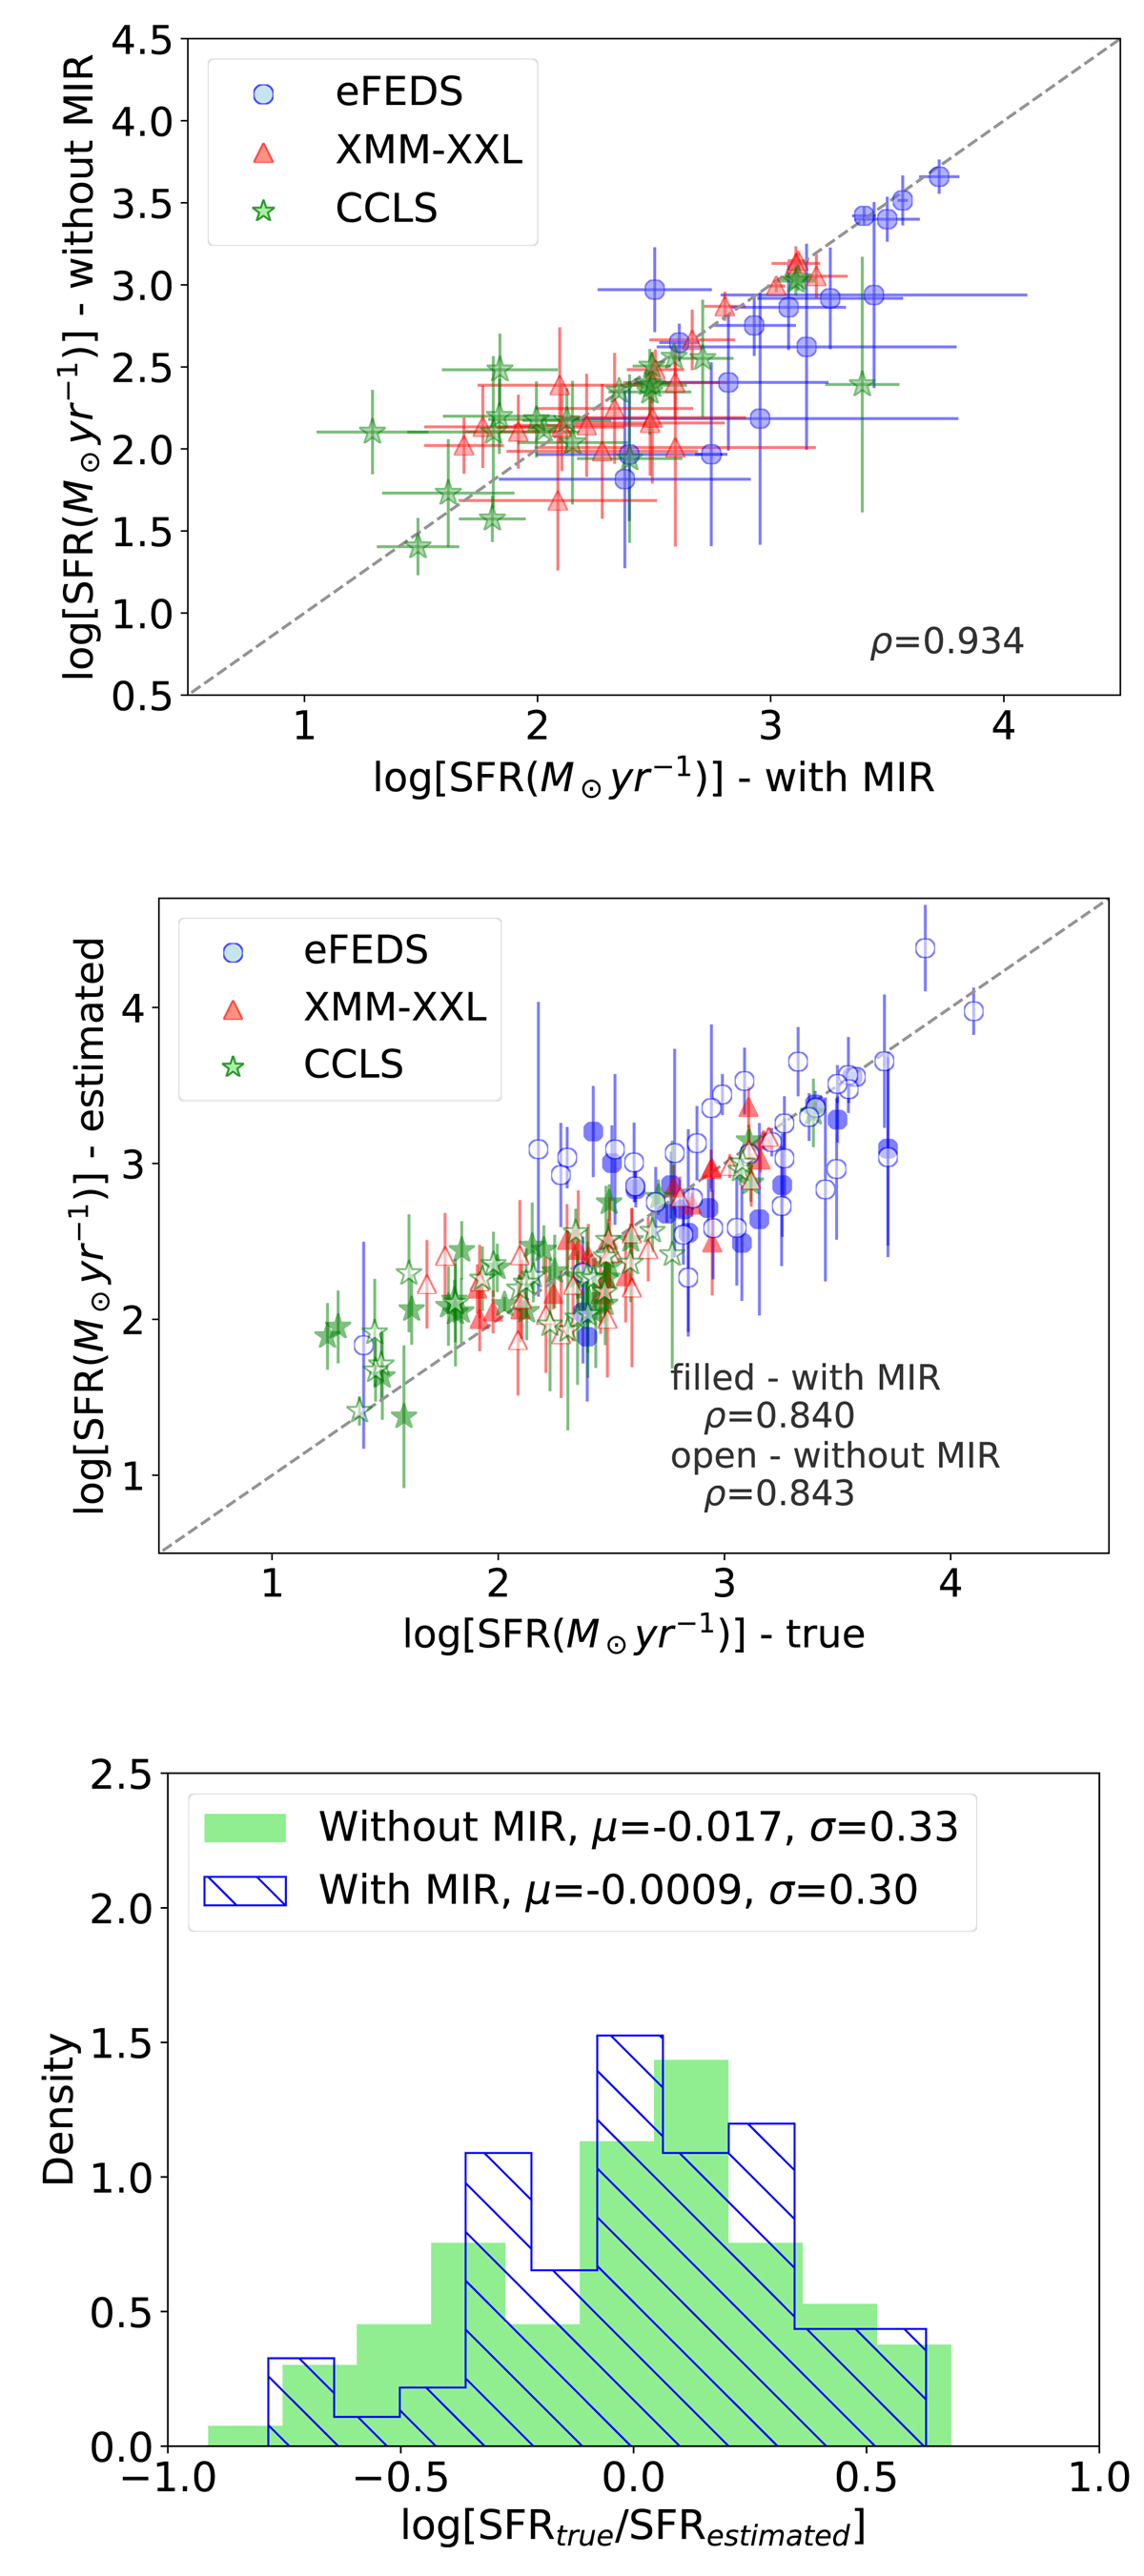
Reliability of the SFR estimations using the X-CIGALE mock catalogues for sources with and without MIR bands. Top panel: SFR calculation with and without W4 or MIPS1 photometric data. The dashed line represent the one-to-one relation. The two measurements are consistent as indicated by the Pearson coefficient. Middle panel: Estimated SFR based on the mock catalogues compared to the true values provided by the best-fit model. The filled (open) symbols represent the X-XIGALE runs with (without) MIR data. X-CIGALE can successfully recover the SFR of the host galaxy, even in the absence of W4 or MIPS photometry, as indicated by the Pearson correlation factor. Bottom panel: Distributions of the difference between estimated and true values. The two distributions are very similar based on the mean and dispersion values.
Current usage metrics show cumulative count of Article Views (full-text article views including HTML views, PDF and ePub downloads, according to the available data) and Abstracts Views on Vision4Press platform.
Data correspond to usage on the plateform after 2015. The current usage metrics is available 48-96 hours after online publication and is updated daily on week days.
Initial download of the metrics may take a while.