Fig. B.1.
Download original image
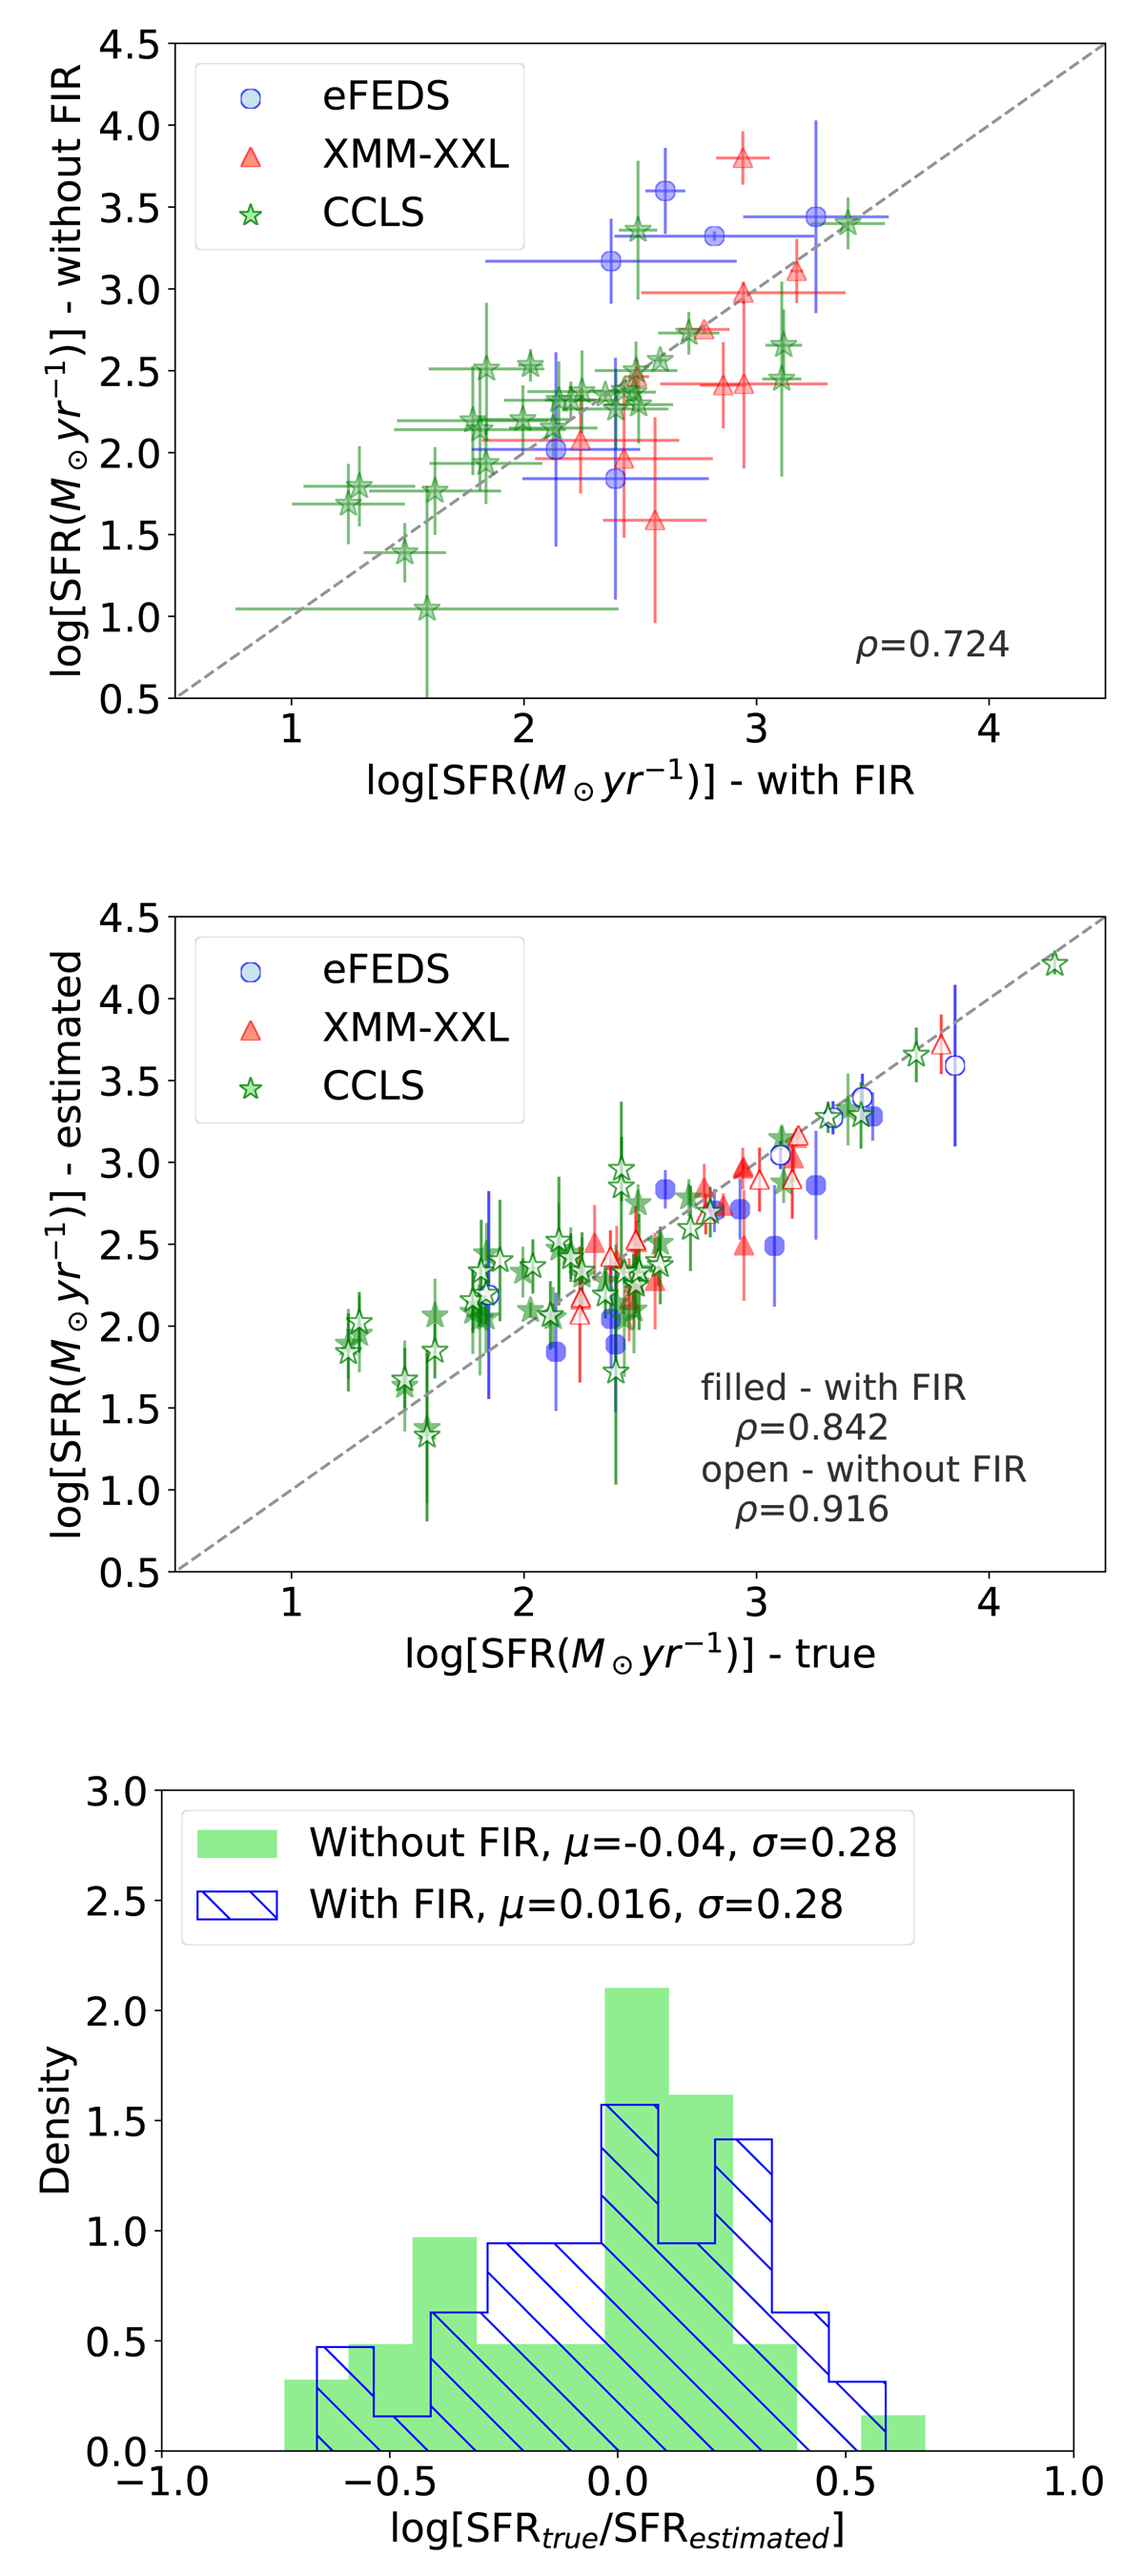
Reliability of the SFR estimations using the X-CIGALE mock catalogues for sources with and without FIR bands. Top panel: Comparison of SFR measurements with and without FIR photometry, for the high-z sources that have FIR coverage and satisfy our quality selection criteria (Sect. 3.2). The dashed lines lines present the 1:1 relation. The parameter calculations are in good agreement based on the Pearson correlation factor, ρ given in the plot. Middle panel: Estimated SFR based on the mock catalogues compared to the true values provided by the best-fit model for the three fields used in our analysis. The filled (open) symbols represent the X-CIGALE runs with (without) FIR data. The dashed line represent the 1-to-1 relation to assist the plot interpretation, while in each plot we give the linear Pearson correlation coefficient (ρ) of the combined sample. Bottom panel: Corresponding distributions of the difference between estimated and true values. We provide also the mean and standard deviation for each case.
Current usage metrics show cumulative count of Article Views (full-text article views including HTML views, PDF and ePub downloads, according to the available data) and Abstracts Views on Vision4Press platform.
Data correspond to usage on the plateform after 2015. The current usage metrics is available 48-96 hours after online publication and is updated daily on week days.
Initial download of the metrics may take a while.