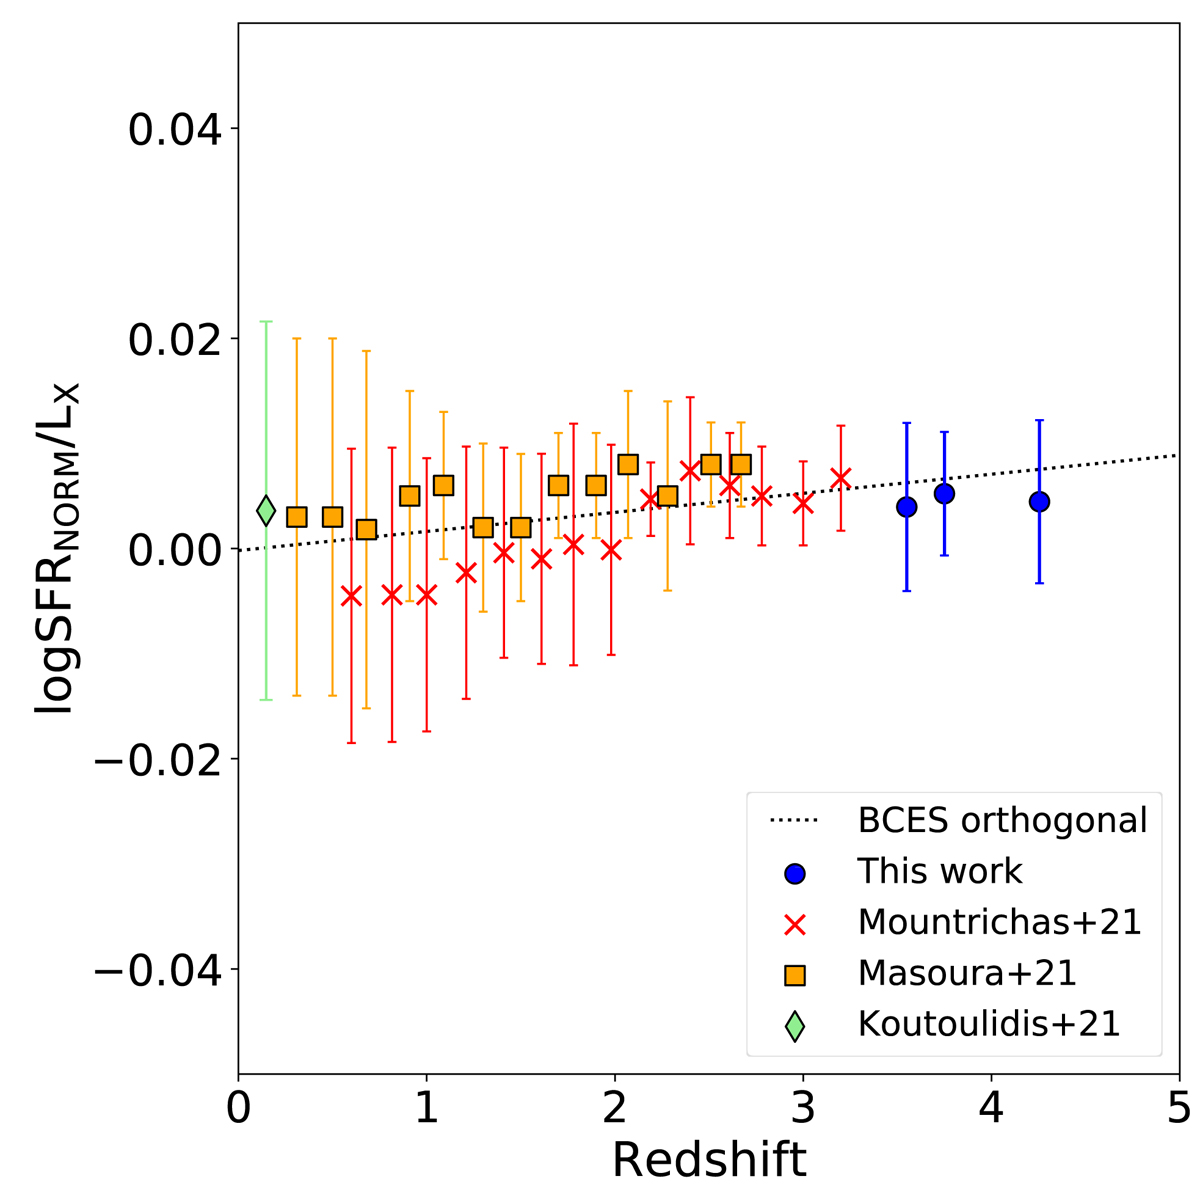
Fig. 10.
Download original image
SFRNORM over LX (in logarithmic scale) as a function of redshift. Our results are divided into three bins (blue circles) of equal size with uncertainties calculated with the bootstrap resampling method. We also plot the data points from X-ray-selected samples with a variety of luminosity and redshift ranges as shown in the legend. The dotted line shows the best linear-fit function: y = 0.0018 ± 0.0005 × x − 0.0002 ± 0.0013.
Current usage metrics show cumulative count of Article Views (full-text article views including HTML views, PDF and ePub downloads, according to the available data) and Abstracts Views on Vision4Press platform.
Data correspond to usage on the plateform after 2015. The current usage metrics is available 48-96 hours after online publication and is updated daily on week days.
Initial download of the metrics may take a while.