Fig. 17
Download original image
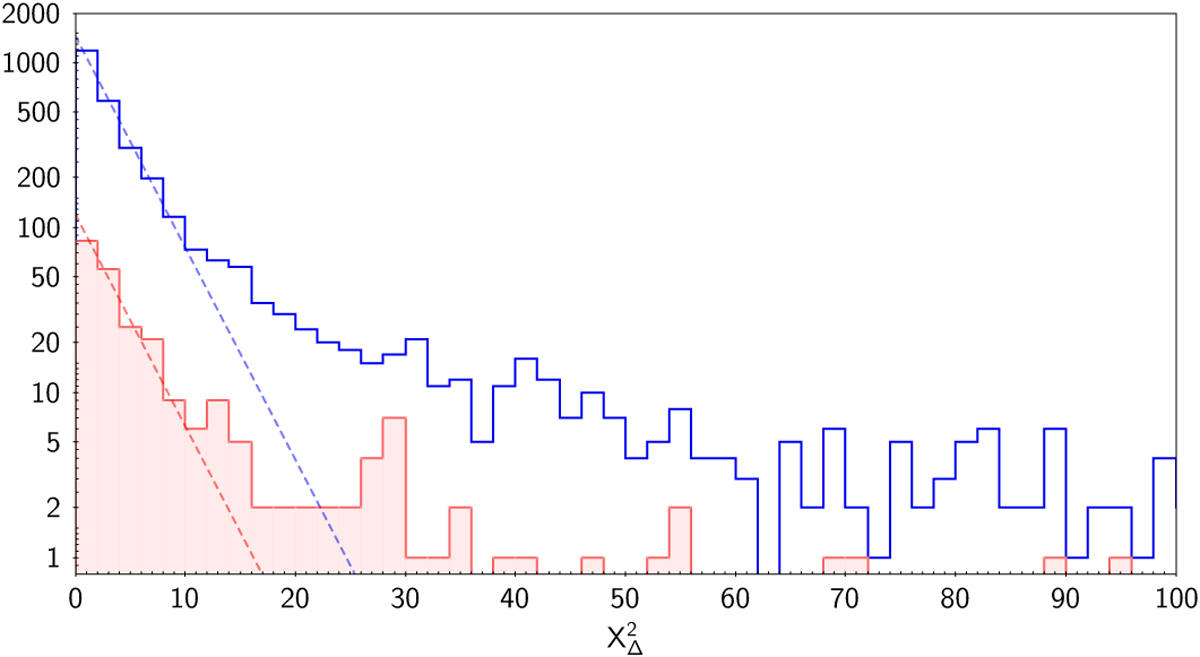
Histograms of the normalised separations ![]() between Gaia-CRF3 and ICRF3 S/X for the full set of 3142 common sources (blue) and the 259 defining sources (red). The dashed curves are the exponential functions described in the text. A total of 195 sources have XΔ > 10 and fall outside this plot (10 of them are defining sources in ICRF3).
between Gaia-CRF3 and ICRF3 S/X for the full set of 3142 common sources (blue) and the 259 defining sources (red). The dashed curves are the exponential functions described in the text. A total of 195 sources have XΔ > 10 and fall outside this plot (10 of them are defining sources in ICRF3).
Current usage metrics show cumulative count of Article Views (full-text article views including HTML views, PDF and ePub downloads, according to the available data) and Abstracts Views on Vision4Press platform.
Data correspond to usage on the plateform after 2015. The current usage metrics is available 48-96 hours after online publication and is updated daily on week days.
Initial download of the metrics may take a while.