Fig. 14
Download original image
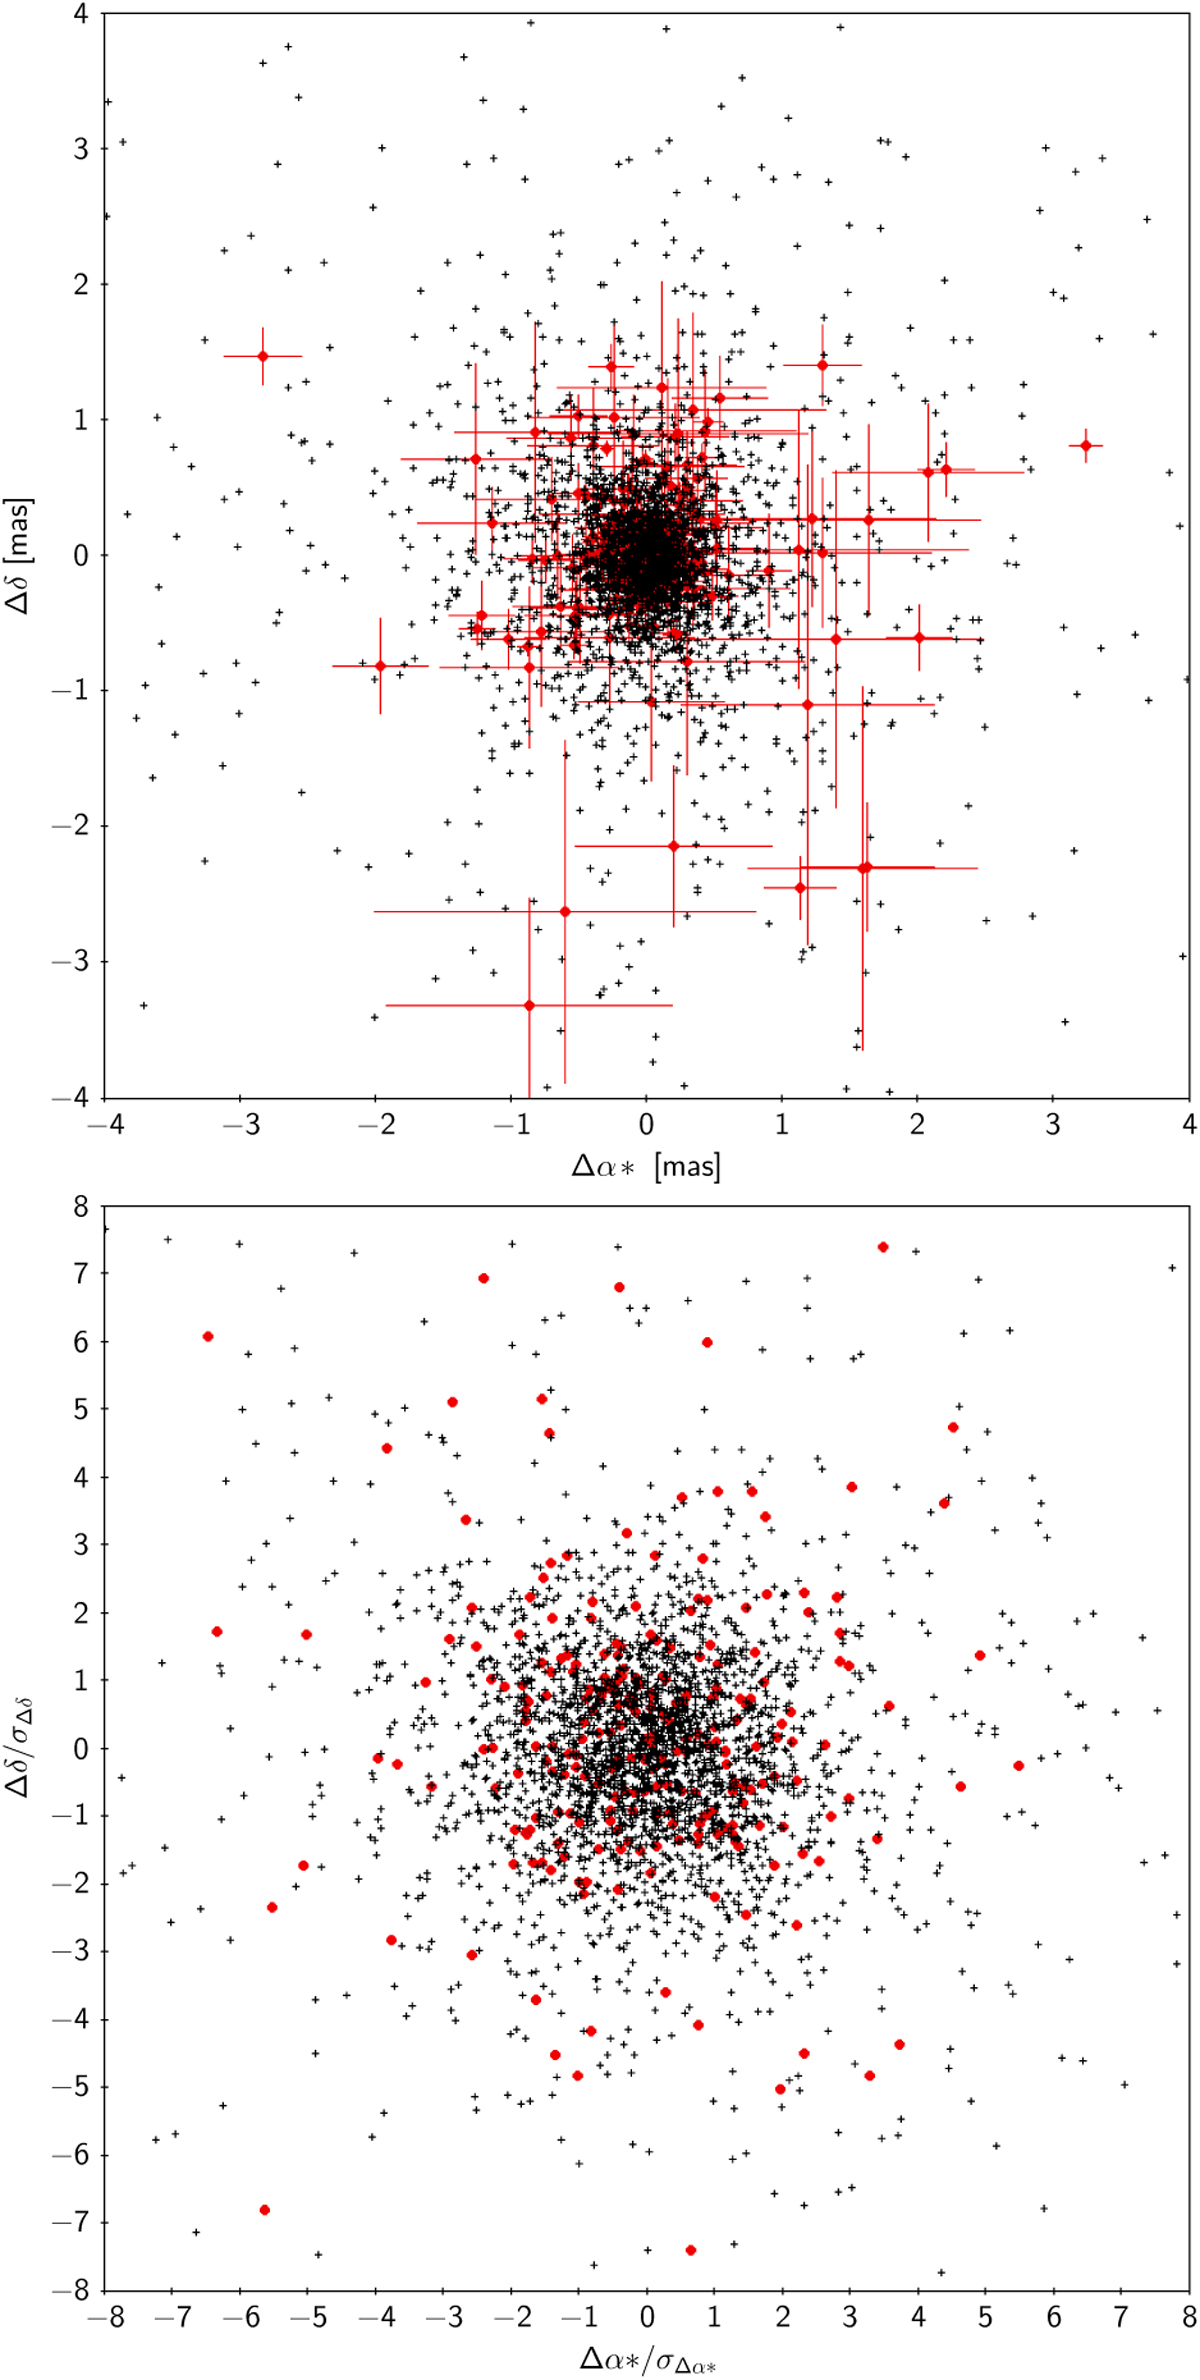
Positional differences in α and δ between Gaia-CRF3 and ICRF3 S/X for the 3142 common sources. The 259 defining sources in ICRF3 are shown as filled red circles, other sources as black crosses. Top: differences in mas. Errors bars representing the quadratically combined uncertainties in the two catalogues are shown only for the defining sources. Bottom: same differences divided by the quadratically combined uncertainties in the two catalogues. No error bars are shown in this plot, as they would all be ±1 unit.
Current usage metrics show cumulative count of Article Views (full-text article views including HTML views, PDF and ePub downloads, according to the available data) and Abstracts Views on Vision4Press platform.
Data correspond to usage on the plateform after 2015. The current usage metrics is available 48-96 hours after online publication and is updated daily on week days.
Initial download of the metrics may take a while.