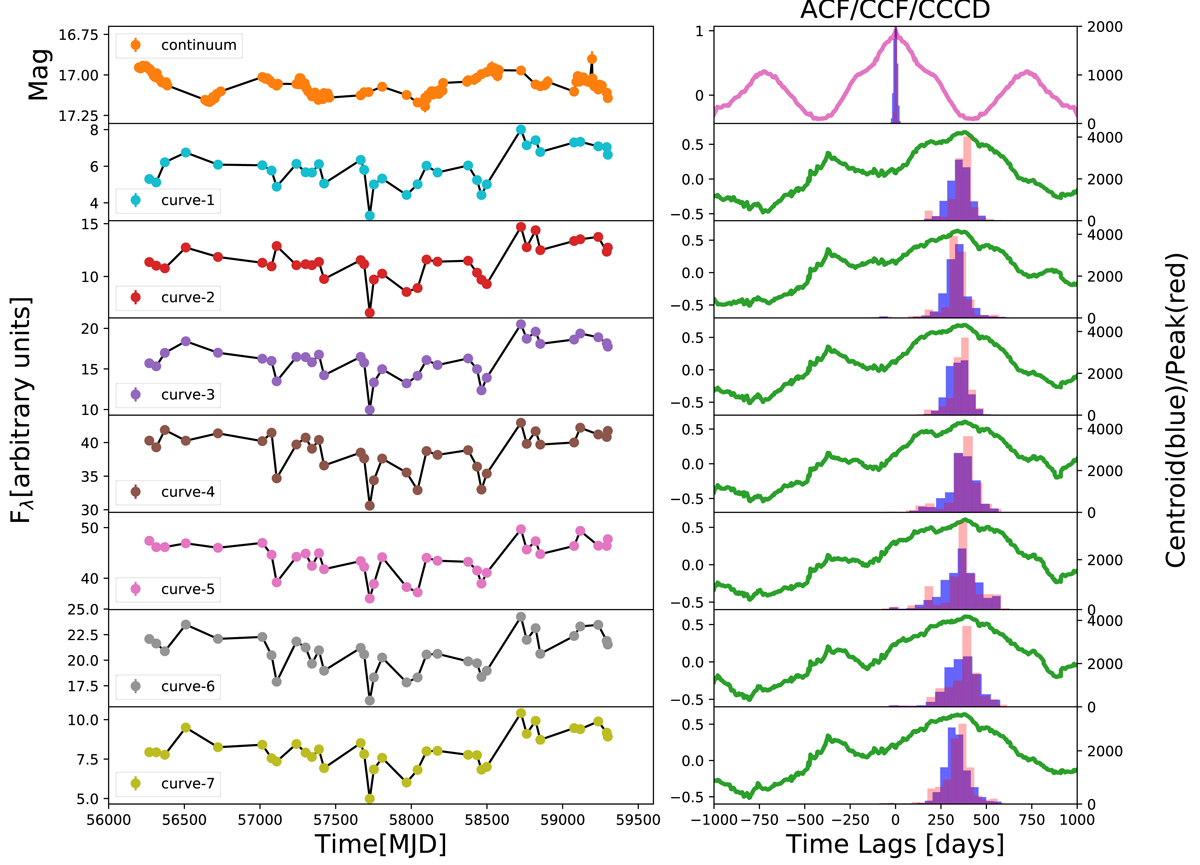
Fig. 8.
Download original image
First column: continuum light curve in magnitude (first panel) and the seven curves in different wavebands derived from the combination of photometric and the spectroscopic observations (remaining panels). The corresponding waveband ranges are listed in Table 3. Curves 1 and 7 are in unit of 10−17 and other curves are in 10−16. Second column: auto-correlation of continuum and the ICCF results for all the curves with respect to continuum. Histograms are the peak (red) and centroid (blue) distribution from the ICCF with 10 000 bootstrap realizations.
Current usage metrics show cumulative count of Article Views (full-text article views including HTML views, PDF and ePub downloads, according to the available data) and Abstracts Views on Vision4Press platform.
Data correspond to usage on the plateform after 2015. The current usage metrics is available 48-96 hours after online publication and is updated daily on week days.
Initial download of the metrics may take a while.